This is the long-form deep-dive. For a quicker, skim-readable version, see the companion blog post.
1. Introduction: habit stacks vs real workloads
Technology choices in mature organisations rarely fail because nobody read a benchmark blog post. They fail because the process for choosing is weak: a loud senior engineer’s preference, a hiring pipeline full of one language, or a single impressive demo at a conference. Meanwhile the product mixes latency-sensitive APIs, batch reconciliation, edge authentication in NGINX, internal CLIs, and the occasional serverless spike. One runtime cannot be optimal for all of those shapes.
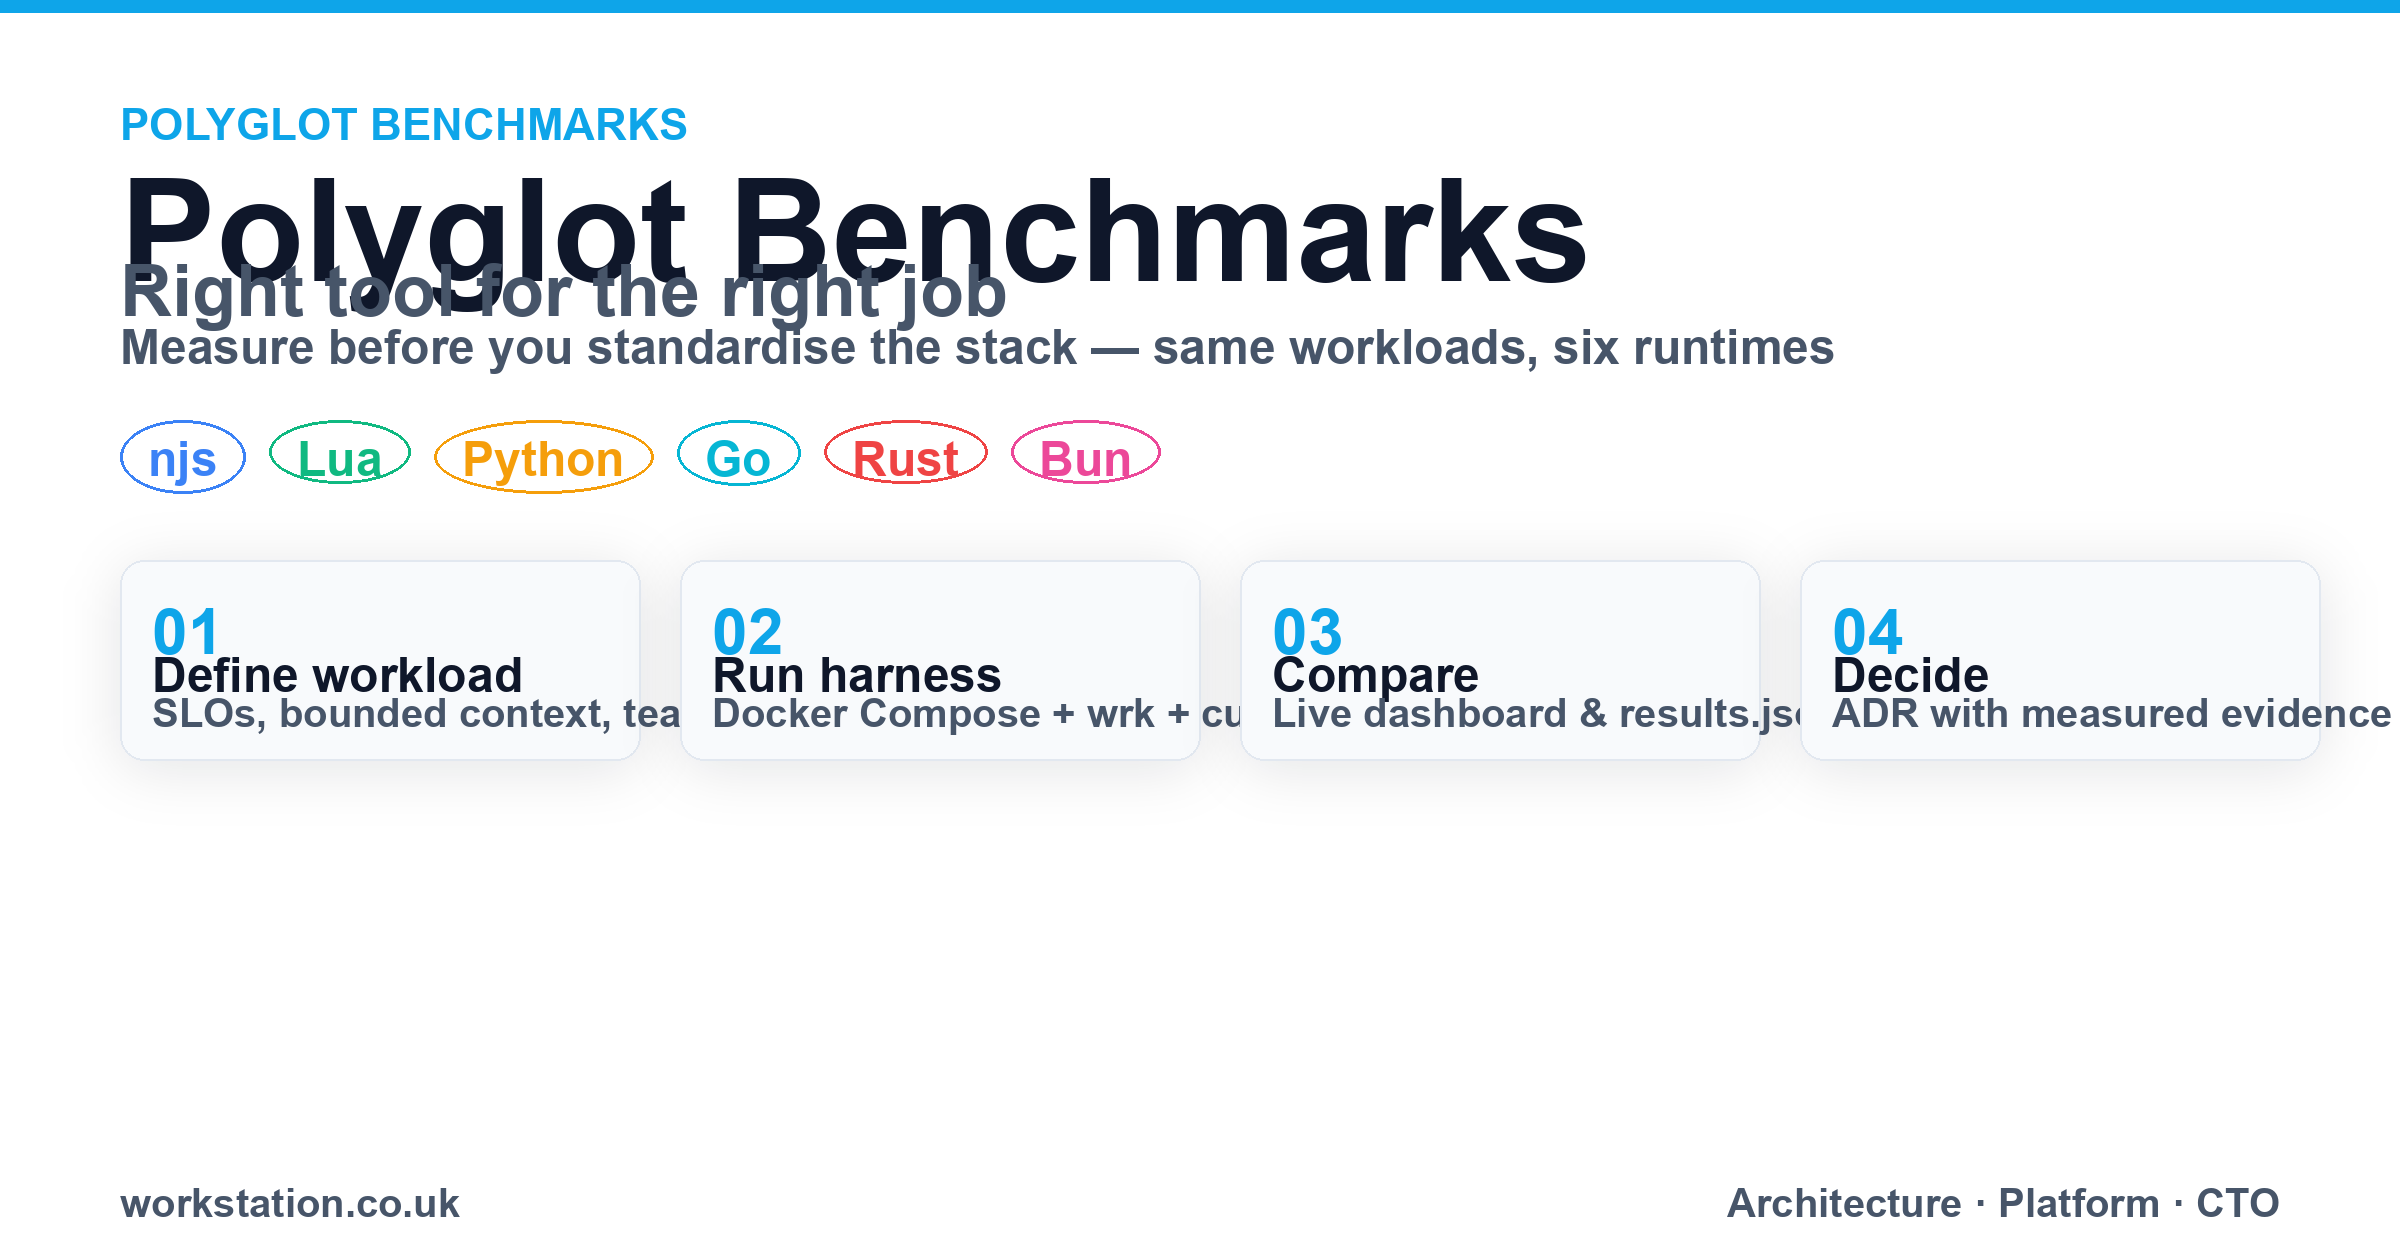
This article explains Polyglot Benchmarks — a live comparison dashboard and the open workflow-examples/benchmarks harness behind it — as a decision framework, not a fanboy leaderboard. The goal is evidence you can attach to an architecture decision record (ADR): same endpoints, same load generator, same container layout, multiple languages.
I will not invent throughput numbers in prose. When you run the harness, the dashboard shows measured req/s and latency percentiles for that hardware and Docker setup. Treat any static ranking here as qualitative patterns aligned with the harness’s test families and the dashboard’s built-in verdict copy.
2. What is Polyglot Benchmarks?
Live benchmark results
Charts and summary from the live dashboard (Rust 5, Lua 1, Go 1 tests won on the reference run; wrk 10s / 4 threads / 100 connections).
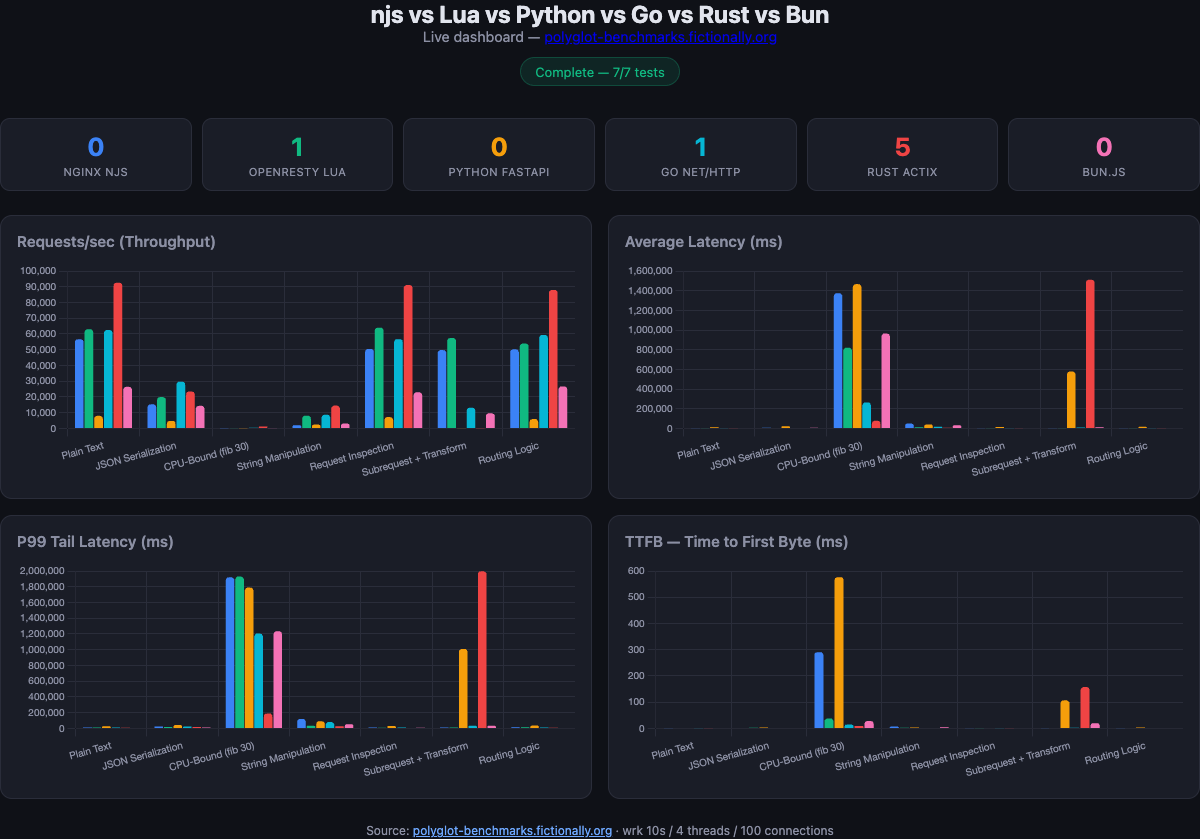
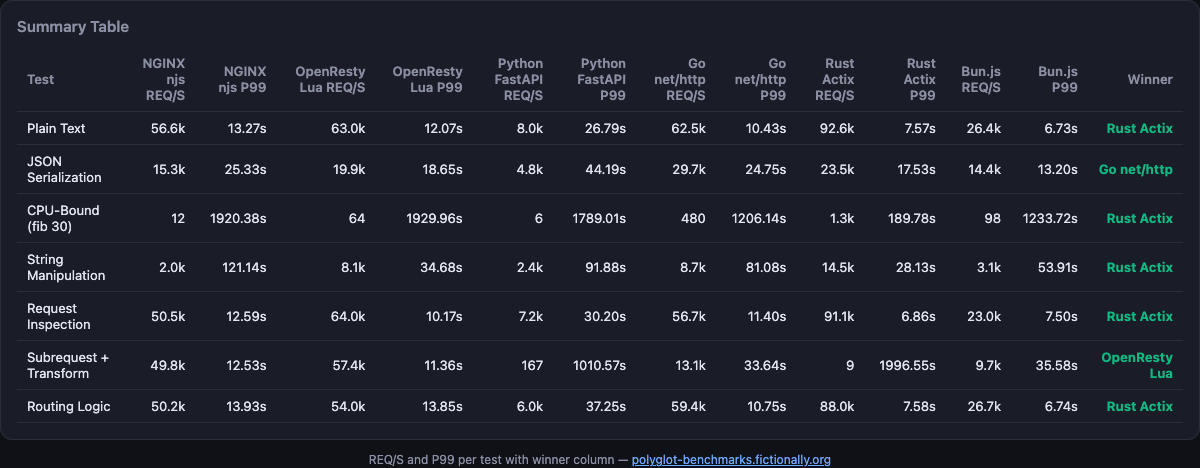
Polyglot Benchmarks is hosted at polyglot-benchmarks.fictionally.org (Fictionally-branded infrastructure in the workflow-examples ecosystem). The landing headline compares:
- NGINX njs — JavaScript modules inside stock NGINX
- OpenResty Lua — Lua at the edge on OpenResty
- Python FastAPI — Uvicorn ASGI app
- Go net/http — standard library server
- Rust Actix-web — async HTTP on Actix
- Bun — JavaScript runtime with native HTTP server
The subtitle on the site frames the intent: performance for long polling / chat / queue / API workloads — connection-heavy, JSON-heavy, and routing-heavy paths rather than a single “hello world” chariot race.
2.1 What the dashboard shows
While a run progresses, the UI polls /data/results.json every two seconds and renders:
- Requests/sec (throughput) — aggregated from
wrkper language per test - Average latency and P99 tail latency — in milliseconds from wrk’s latency model
- TTFB (time to first byte) — from curl timing JSON alongside wrk
- Summary table — per-test winners with ★ markers on best cells
- Detailed test cards — bar charts and metric tables (P50, P90, P99.9, errors)
- Latency percentile distribution — averaged across tests
- Verdict — best for your use case — narrative once status is
complete
That structure is deliberately ARB-friendly: charts for slides, tables for spreadsheets, narrative for the risk section of an ADR.
3. The workflow-examples harness
Everything reproducible lives under benchmarks/ in the workflow-examples repository. Top-level layout:
benchmarks/
  bench.sh              # orchestrates tests, writes results.json
  wrk_json.lua          # wrk done() → JSON summary (RPS, percentiles)
  docker-compose.yml    # six app services + dashboard + bench runner
  njs/                  # NGINX + njs module
  lua/                  # OpenResty nginx.conf
  python/               # FastAPI + Dockerfile
  golang/               # net/http main.go
  rust/                 # Actix-web + Cargo
  bun/                  # Bun server.ts
  dashboard/            # static index.html + nginx.conf
3.1 Docker Compose topology
docker-compose.yml defines isolated services on a shared network:
nginx-njs— port 8081, configs from./njsopenresty-lua— port 8082python-fastapi— port 8084, built from./pythongo-server— port 8085rust-actix— port 8086bun-server— port 8087dashboard— port 8083, serves HTML and mounts theresultsvolume at/databench— Alpine container that installscurl,wrk,jq, waits for dependencies, runsbench.sh
The bench runner shares the results volume with the dashboard so results appear live without manual copy.
3.2 bench.sh methodology
The shell driver encodes fairness rules explicitly:
- Duration:
10sper endpoint per language - Threads: 4
- Connections: 100 concurrent
- Warmup: 50 rounds hitting
/helloon every server before timed tests - Per server: curl timing JSON (dns, connect, ttfb, total) plus wrk with
wrk_json.lua
Seven tests are pipe-delimited in the script:
| ID | Name | Intent | Endpoint |
|---|---|---|---|
| 1 | Plain Text | Baseline — minimal response, framework overhead | /hello |
| 2 | JSON Serialization | Build and serialize 100-item JSON array | /json |
| 3 | CPU-Bound (fib 30) | Recursive fibonacci(30) — pure CPU | /cpu?n=30 |
| 4 | String Manipulation | Build, split, uppercase, rejoin 1000 segments | /string |
| 5 | Request Inspection | Headers, method, args → JSON | /request_info?foo=bar&baz=123 |
| 6 | Subrequest + Transform | Internal subrequest, parse JSON, transform | /subrequest |
| 7 | Routing Logic | Conditional routing on query params | /route?action=greet&name=bench |
Each language implements the same route surface (see golang/main.go, python/main.py, NGINX configs, etc.) so differences reflect runtime and framework, not mismatched specs.
4. Why “polyglot” matters (without fanaticism)
Polyglot architecture does not mean every engineer learns six languages. It means bounded contexts get a runtime that fits:
- Edge plane — auth, rate limits, routing: Lua or njs inside NGINX you already operate
- Core API plane — business logic with SLOs: Go or Rust
- Data plane — ETL, notebooks, ML glue: Python
- Real-time JS plane — WebSockets, shared types with frontend: Bun or Node where velocity wins
Uniform stacks optimise HR and procurement. Polyglot benchmarks optimise fit per workload with measurable trade-offs on the table.
5. Dimensions that matter
Raw req/s is the metric that travels fastest on Slack. It is also the easiest to misread. Use a multi-column rubric:
| Criterion | Dominates when… | Harness signal |
|---|---|---|
| p50 / p99 latency | User-facing APIs, chat, long poll | wrk latency percentiles; dashboard P99 chart |
| Throughput (RPS) | High fan-out gateways, batch aggregators | wrk RPS; summary winner column |
| Memory per connection | Thousands of idle WebSockets | Qualitative + production profiling (not fully in harness) |
| TTFB | CDN miss, cold paths, mobile networks | curl time_starttransfer in results JSON |
| LOC / complexity | Startups, regulated change control | Compare implementations across folders |
| Build & CI time | Frequent deploys, many services | Docker build profiles per language |
| Ops burden | Small platform team | Existing NGINX skills → Lua/njs; else containers |
| Hosting cost | Always-on vs scale-to-zero | Derived from memory + CPU under load (production) |
6. Decision matrix
The diagram below is the qualitative map we use in reviews — illustrative leaders, not a substitute for running the harness on your kit.
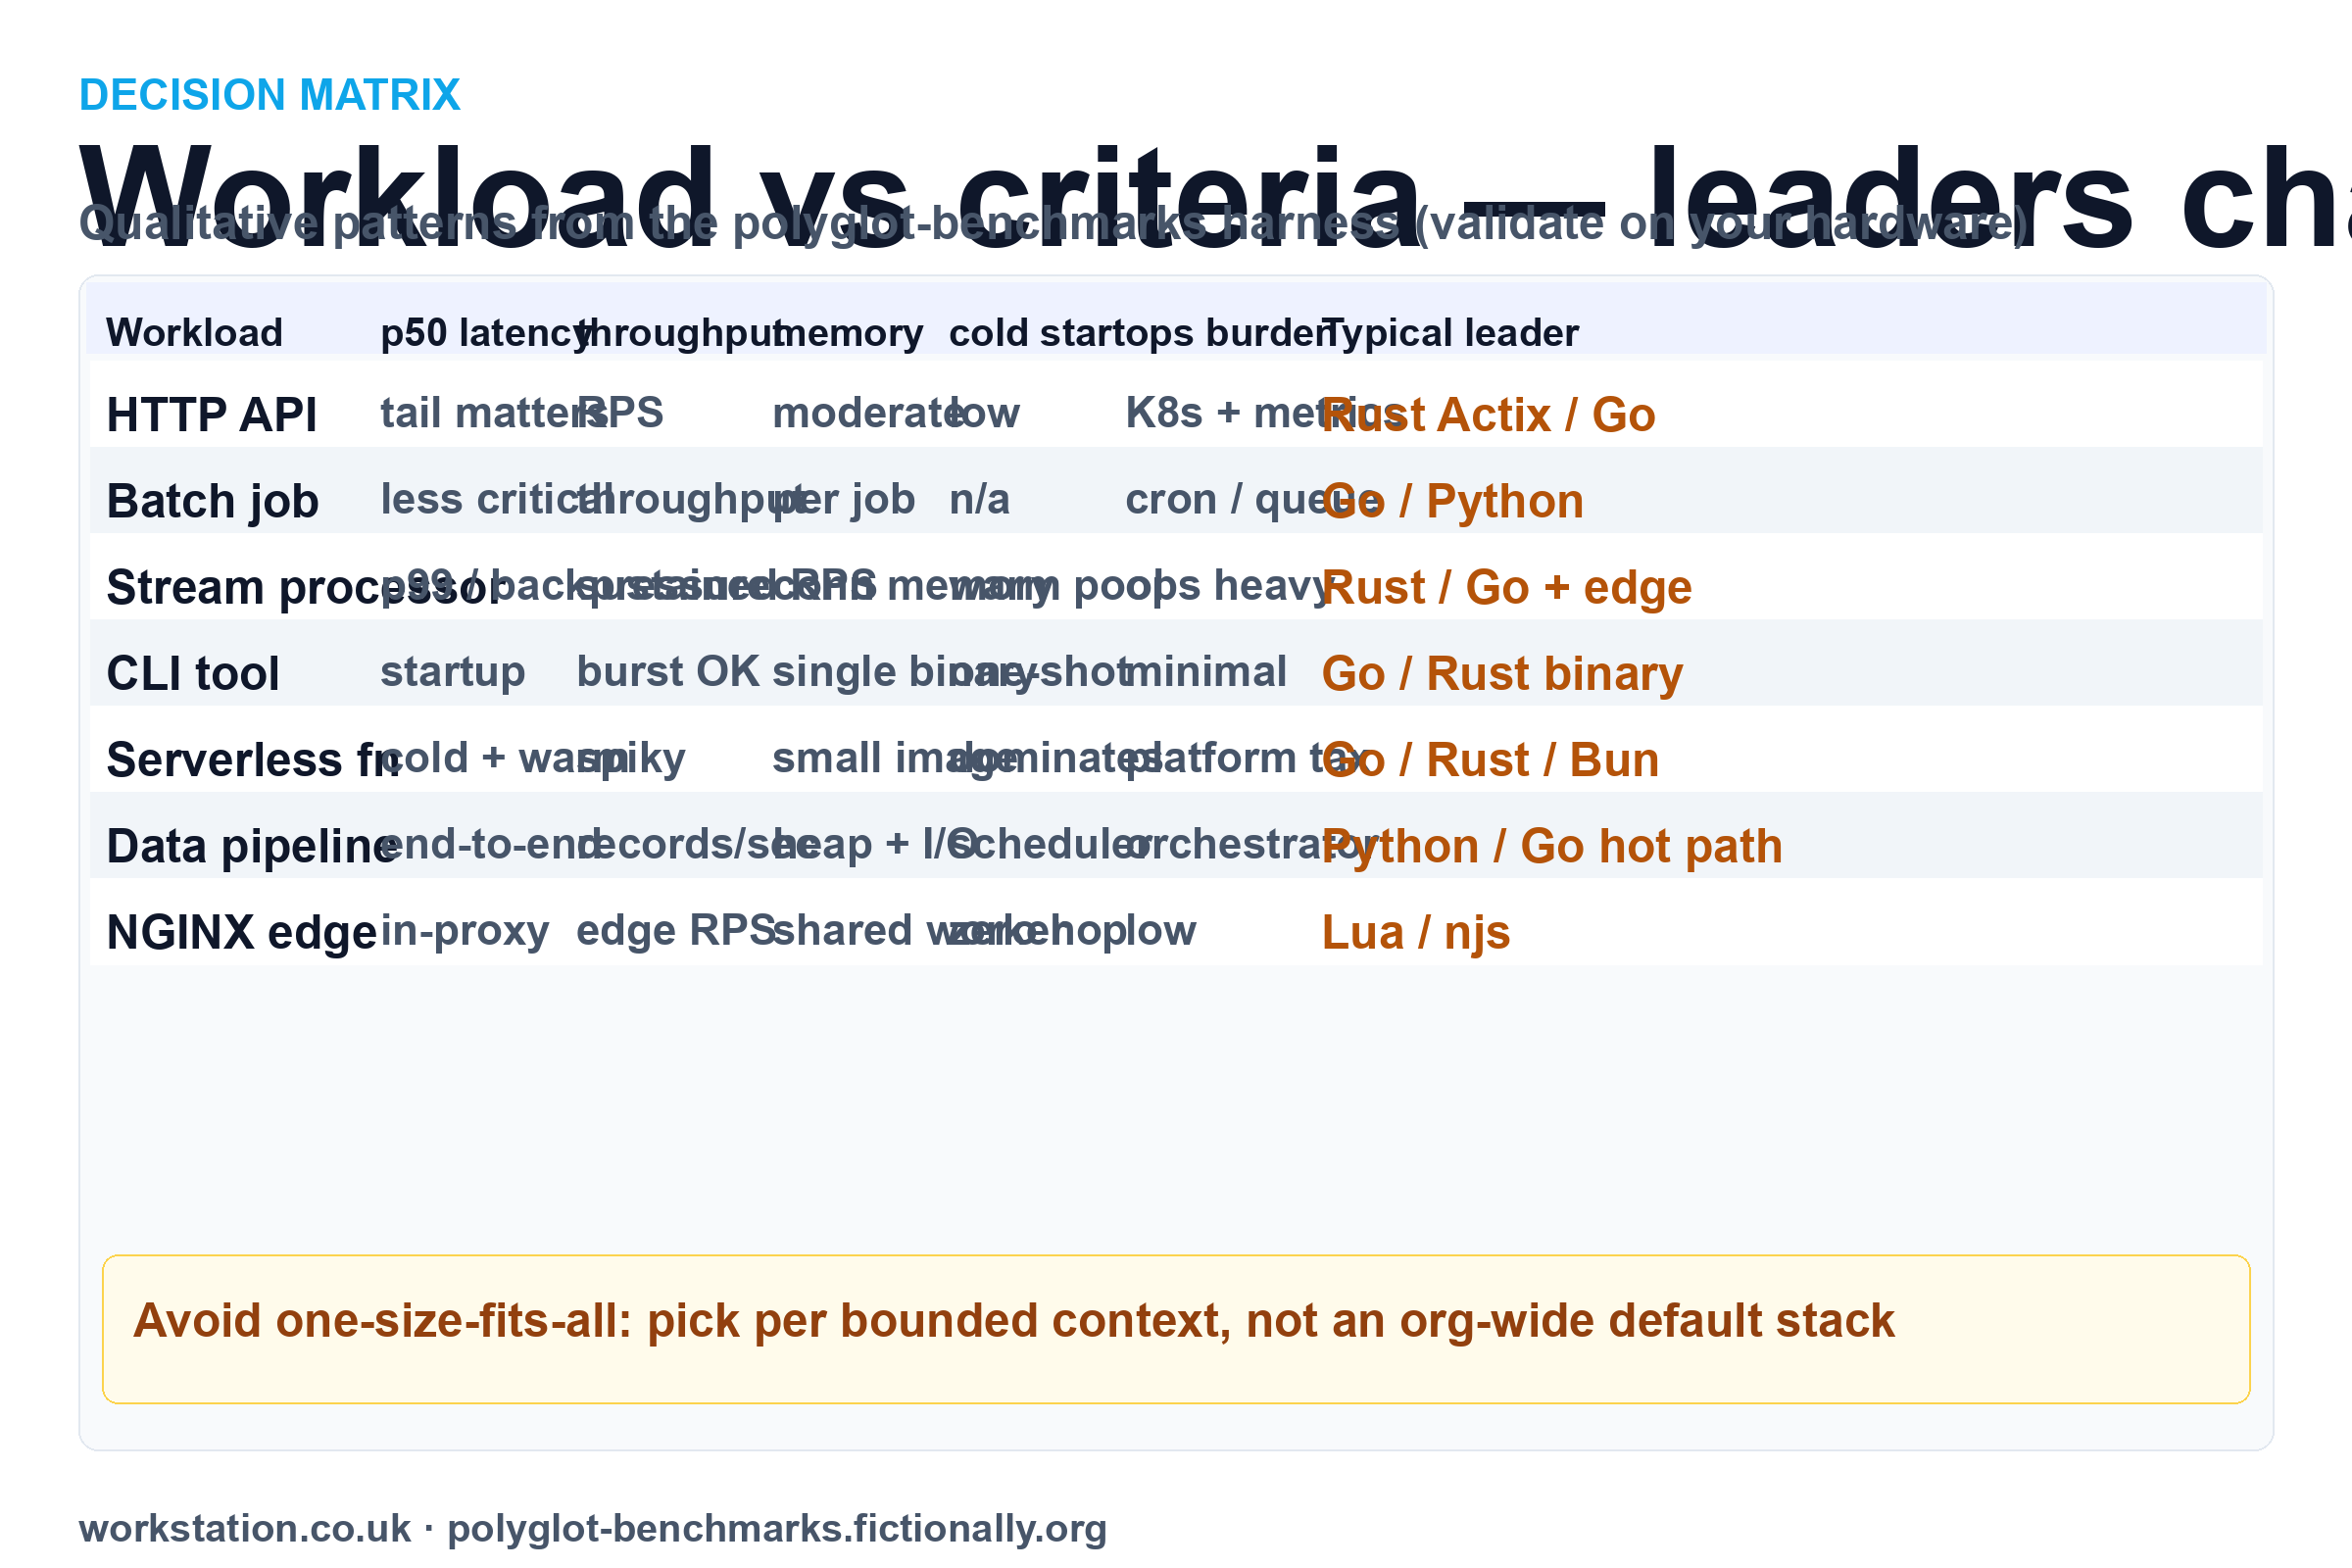
Read it row-first: pick your workload shape, then weight columns. If two criteria conflict (e.g. best RPS vs lowest LOC), that tension is the ADR discussion worth having.
7. Case patterns (example labelling)
The following maps harness test families to architectural choices. Leaders on your machine appear on the dashboard after a run — do not treat this section as fixed scores.
7.1 API latency-sensitive (Tests 1–2, 5–7)
JSON APIs and routing-heavy handlers mirror Tests 2, 5, and 7. Compiled async runtimes (Rust Actix, Go) typically lead on throughput and tail latency in this class of synthetic HTTP benchmarks; Bun often sits close on JSON-heavy paths with JS ergonomics. Python FastAPI trades raw RPS for development speed — the dashboard verdict calls this out explicitly.
7.2 CPU-bound micro-work (Test 3)
Fibonacci(30) isolates CPU without I/O. Expect Rust and Go to shine; interpreted stacks pay overhead. If your real service is I/O bound, do not over-weight this row — it is a stress test for compute-heavy middleware, not typical CRUD.
7.3 Edge transform (Tests 6–7, NGINX variants)
Subrequest and routing tests are where OpenResty Lua and NGINX njs belong: zero extra hop, shared worker memory, ops teams already manage NGINX. The harness’s verdict recommends Go/Rust for core chat/queue backends and Lua/njs at the edge — a sensible split many enterprises already run informally.
7.4 Batch ETL and data pipeline
The HTTP harness does not emulate Spark or warehouse loads. For batch, teams usually prioritise Python ecosystem and orchestration (Airflow, Dagster) or Go workers for throughput. Use Polyglot Benchmarks for the API surfaces and control planes those jobs expose, not for the batch engine itself.
7.5 Quick internal tool
Internal admin APIs with low QPS and high change rate: Python or Bun/Node often win on velocity and hiring. Run Test 2 (JSON) and Test 5 (inspection) to ensure overhead is acceptable; if p99 spikes under 100 connections, reconsider before promoting to customer-facing tiers.
8. Workflow diagram
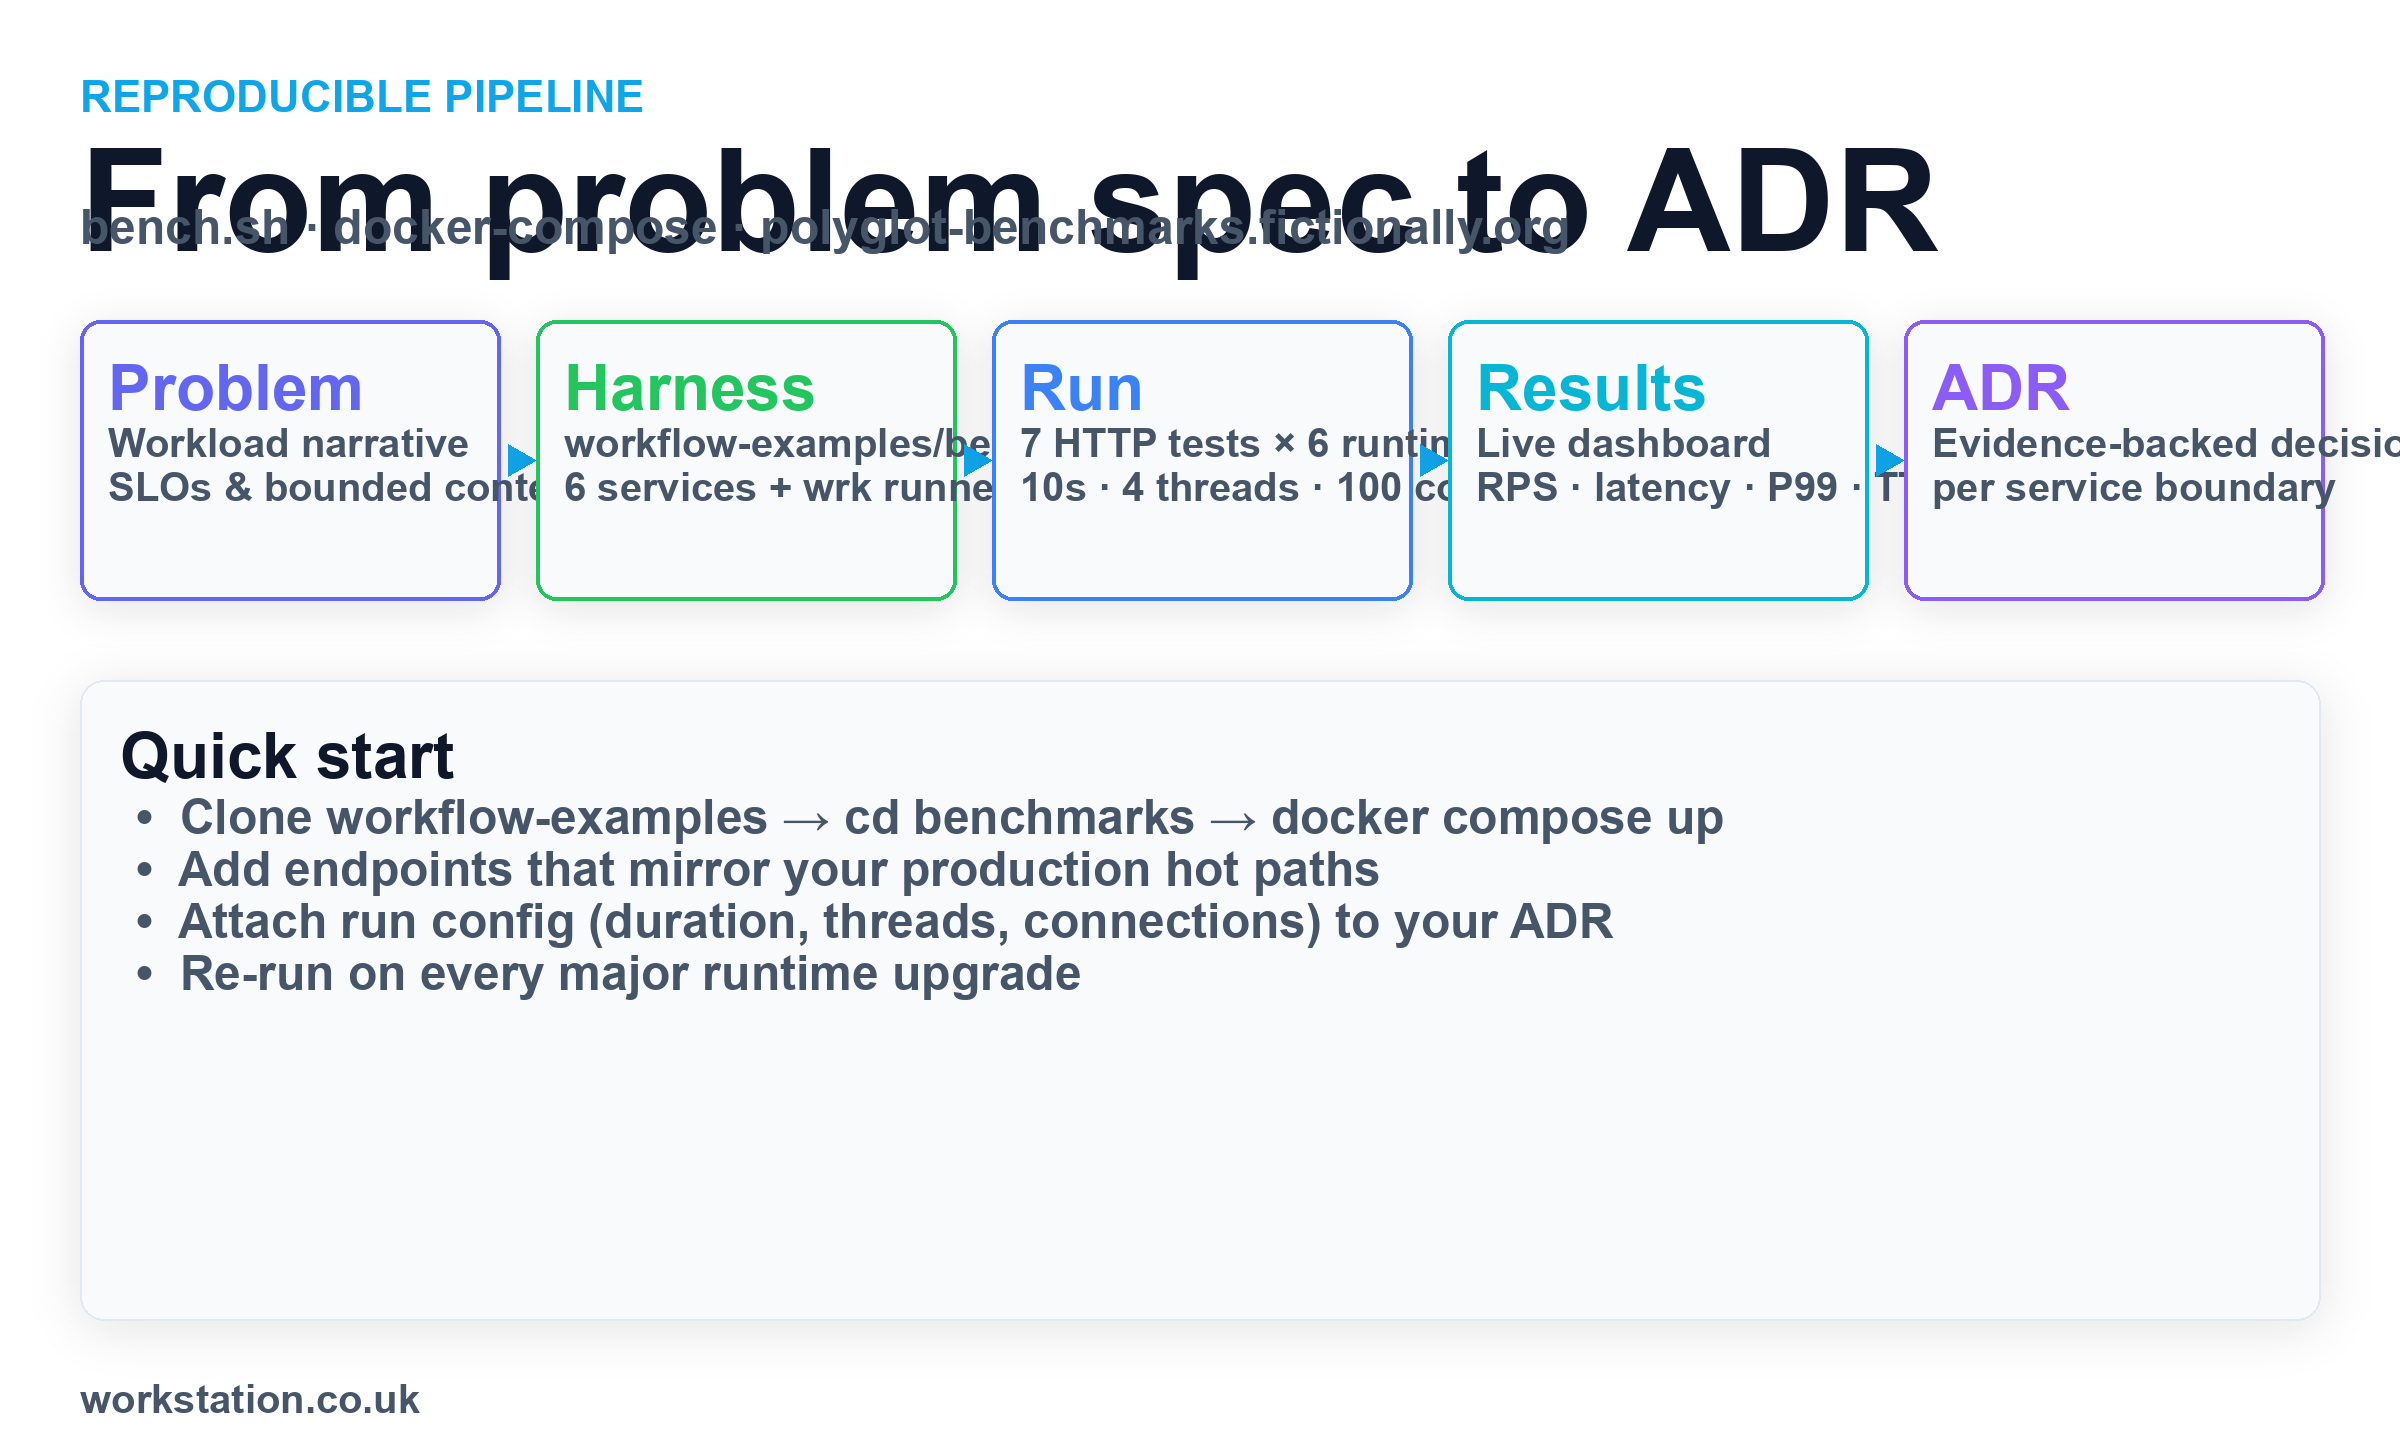
The reproducible loop: specify the workload → run the Compose harness → publish results to the Fictionally dashboard (or your internal clone) → record an ADR with config metadata → re-run when runtimes or hardware change.
9. How to run your own comparison
- Clone:
git clone https://github.com/bwalia/workflow-examples.git && cd workflow-examples/benchmarks - Start stack:
docker compose up --build— builds all language images, starts dashboard on port 8083, runs bench automatically. - Watch: open
http://localhost:8083(or the public site when a hosted run is active). - Extend: add a folder
myruntime/, mirror endpoint paths, register a service indocker-compose.yml, append the server toSERVERSinbench.sh. - Customise load: edit
DURATION,THREADS,CONNECTIONSat the top ofbench.sh— document changes in your ADR. - Add production-shaped tests: e.g. auth middleware, ORM query, 50KB payload — keep parity across languages.
For CI, run Compose in a nightly workflow, archive results.json as an artifact, and fail only on regression thresholds you define (e.g. p99 +20% week over week on Test 2).
10. Anti-patterns
- Picking the winner of Test 1 only — plain text favours minimal stacks; it ignores JSON, CPU, and routing pain.
- Ignoring team skills — Rust in production without mentors is expensive in incident time.
- Ignoring hosting cost — 2× RPS is useless if memory per pod doubles your bill.
- Mandating one language org-wide — destroys legitimate edge vs core splits.
- Replacing production profiling — synthetic HTTP ≠ your ORM, cache, or regional latency.
- Comparing unlike hardware — laptop Docker ≠ bare metal ≠ K8s limits; note the class in the ADR.
11. Benefits for engineering leadership
- ARB packs — export dashboard screenshots +
results.json+ Compose hash. - Vendor-neutral evidence — no sales deck from a single cloud or framework vendor.
- Onboarding clarity — new hires see *why* service A is Go and service B is Python.
- Risk reduction — pilot the runner-up in a shadow service before rewrites.
- FinOps conversations — link tail latency to autoscaling and memory headroom.
- Platform roadmap — justify NGINX skill investment vs another K8s microservice.
12. Limitations
- Synthetic workloads — seven HTTP tests cannot represent Kafka consumers, GPU jobs, or complex ORM graphs.
- Docker networking — adds overhead; absolute numbers differ from bare metal.
- Single machine class — hosted results reflect whatever hardware Fictionally uses; your numbers will differ.
- No persistence layer — database and cache effects are absent by design.
- Short run duration — 10s per test may not expose GC pauses or warmup cliffs; extend for stress campaigns.
Keep continuous profiling (eBPF, APM, load tests against staging) as the source of truth for production. Polyglot Benchmarks narrows the language and framework debate with reproducible baselines.
13. Conclusion
Default-stack bias is comfortable; it is also how teams ship the wrong runtime for the job. Polyglot Benchmarks and the workflow-examples harness turn “which language wins?” into “which language wins for this workload row?” — with charts your ARB can cite.
Fork the repo, add the endpoints that look like your hot paths, run Compose, and attach the results to the next architecture decision. The companion blog post is the five-minute version for sharing; this article is the reference.
Published by Workstation (workstation.co.uk). Benchmark dashboard hosted at polyglot-benchmarks.fictionally.org in the Fictionally examples ecosystem.
SEO snapshot for this article
- SEO title: Polyglot Benchmarks: Right Tool for the Job
- Meta description: Compare njs, Lua, Python, Go, Rust, and Bun on the same HTTP workloads. Reproducible harness, live dashboard, decision matrix for architects.
- Primary keywords: polyglot benchmarks, language comparison, architecture decisions, workflow examples, performance benchmark, Rust vs Go, FastAPI benchmark
- Twitter / X (under 280 chars): Polyglot Benchmarks: same 7 HTTP tests across njs, Lua, Python, Go, Rust, Bun — live dashboard + reproducible workflow-examples harness. Not one winner; a decision framework for architects. #polyglot #performance #architecture
- LinkedIn post: We published a deep dive on Polyglot Benchmarks — how to stop picking one org-wide stack from habit and start matching runtimes to workloads. Six languages, seven comparable tests, Docker Compose + wrk, live results at polyglot-benchmarks.fictionally.org, source at github.com/bwalia/workflow-examples/tree/main/benchmarks. Includes decision matrix, anti-patterns, and ADR guidance. From Workstation engineering.