Workstation technical rewrite and expansion of the “Big Prometheus” problem space popularised by Clay Smith’s Monitoring Monitoring essay (Thanos, Cortex, M3DB, VictoriaMetrics). This article adds sharper pros/cons, a MoSCoW analysis across many observability tools, and a recommendation path for Kubernetes-native estates. Companion for managers: Observability is a business standard.
1. The problem Big Prometheus solves
Large organisations accumulate specialised stacks for dashboarding, embedded stats, time-series monitoring, and ad-hoc analysis. That creates silos of data and processing — complex, expensive, and hard to maintain. In Kubernetes land the de facto open-source metrics unit is Prometheus (usually with Grafana and Alertmanager). A common pattern is one Prometheus per cluster via Prometheus Operator / kube-prometheus-stack.
At tens or hundreds of clusters, local Prometheus is no longer enough:
- Global questions (“which clusters are on fire?”) become slow or impossible.
- Retention on every Prometheus disk becomes costly and inconsistent.
- HA and durable history need a deliberate store, not “bigger PVC.”
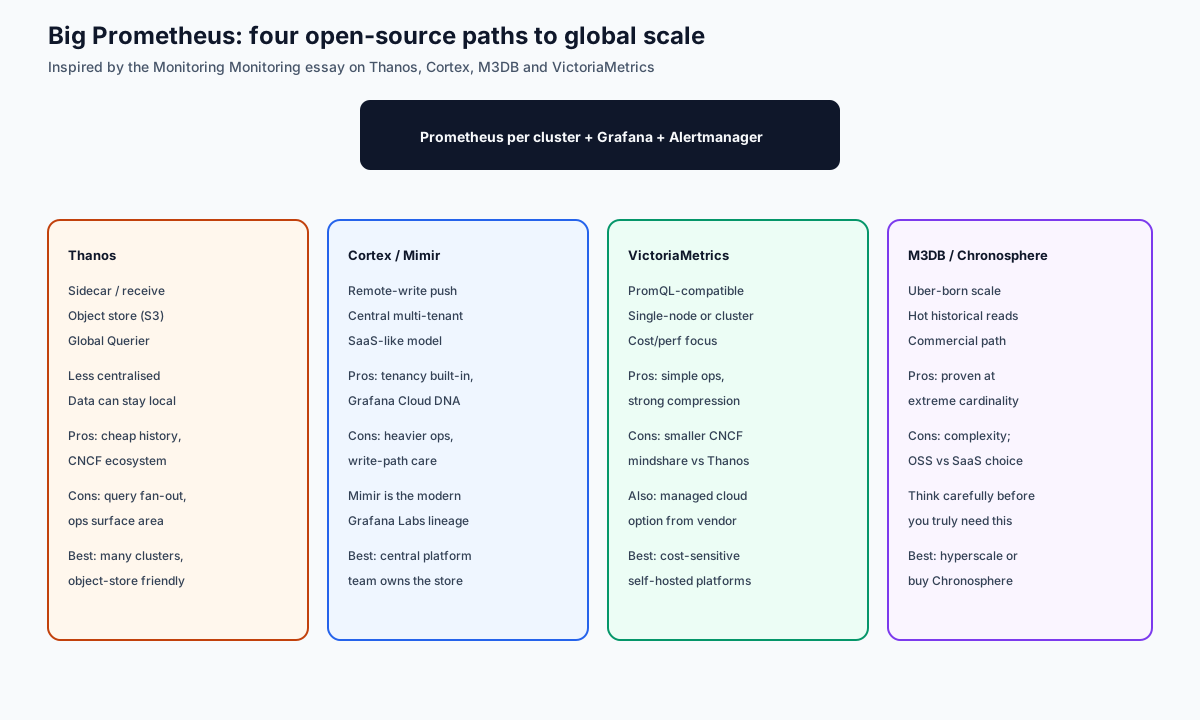
Four major open-source lineages addressed that gap: Thanos, Cortex (and today’s Grafana Mimir), M3DB (and Chronosphere), and VictoriaMetrics. Shared goals: Prometheus compatibility, global fast queries, long-term cheap(er) history, and high availability.
2. Option deep dive — pros and cons that matter
2.1 Thanos
Model: Keep Prometheus closer to the default — sidecars or receive path; query globally; ship blocks to object storage (S3/GCS/Azure).
Pros
- Fits existing Prometheus-per-cluster mental model.
- Object storage for long-term history is usually cheaper than always-hot NoSQL.
- Strong CNCF / community gravity; many production war stories.
- Compactor + downsampling help control cost at age.
Cons
- Global query fan-out can be latency-sensitive; store-gateway tuning matters.
- Operational surface (sidecar, querier, store, compactor, ruler) is real.
- Object-store GET patterns can surprise on bandwidth bills if mis-tuned.
Choose when: You already run many Prometheuses and want global query without a full rewrite of the write path.
2.2 Cortex → Grafana Mimir
Model: SaaS-like central store. Clusters remote_write into a multi-tenant metrics platform. Cortex pioneered this; Grafana Mimir is the modern production-hardened lineage most teams evaluate now.
Pros
- Multi-tenancy and central ownership match a platform-team org chart.
- Familiar to anyone buying Grafana Cloud / running Grafana LGTM.
- Object-store backends are first-class in modern deployments.
- Strong path for recording rules and alert evaluation at the centre.
Cons
- Write-path and ingester/compactor ops are non-trivial at scale.
- Misconfigured remote_write or cardinality can melt the central cluster.
- “Just enable remote_write” without budgets is an expensive hobby.
Choose when: A central observability platform team will own the metrics fabric for many product teams.
2.3 VictoriaMetrics
Model: PromQL-compatible TSDB with a reputation for compression and simpler ops; single-node for small estates, clustered for larger; commercial cloud available.
Pros
- Often excellent cost/performance for self-hosted metrics.
- Operational simplicity relative to full Thanos/Mimir meshes.
- Clear upgrade path from single node to cluster.
- Good fit when FinOps pressure is the primary constraint.
Cons
- Smaller “default CNCF” mindshare than Thanos/Mimir in some ecosystems.
- You still need Grafana, Alertmanager, and an OTEL story around it.
- Vendor cloud vs OSS split needs a clear procurement stance.
Choose when: You want PromQL scale with fewer moving parts and aggressive storage efficiency.
2.4 M3DB / Chronosphere
Model: Uber-born stack optimised for huge cardinality and hot historical reads; Chronosphere commercialises the operational path.
Pros
- Proven at extreme scale where object-store-only history was too slow or too pricey across cloud/on-prem boundaries.
- Commercial offering reduces DIY distributed-systems burden.
Cons
- Complexity and specialisation — easy to over-buy.
- OSS vs SaaS strategy must be explicit.
- Most companies should not start here.
Choose when: Cardinality and historical query patterns have already broken cheaper architectures — or you deliberately buy Chronosphere.
3. MoSCoW analysis of the observability tool landscape
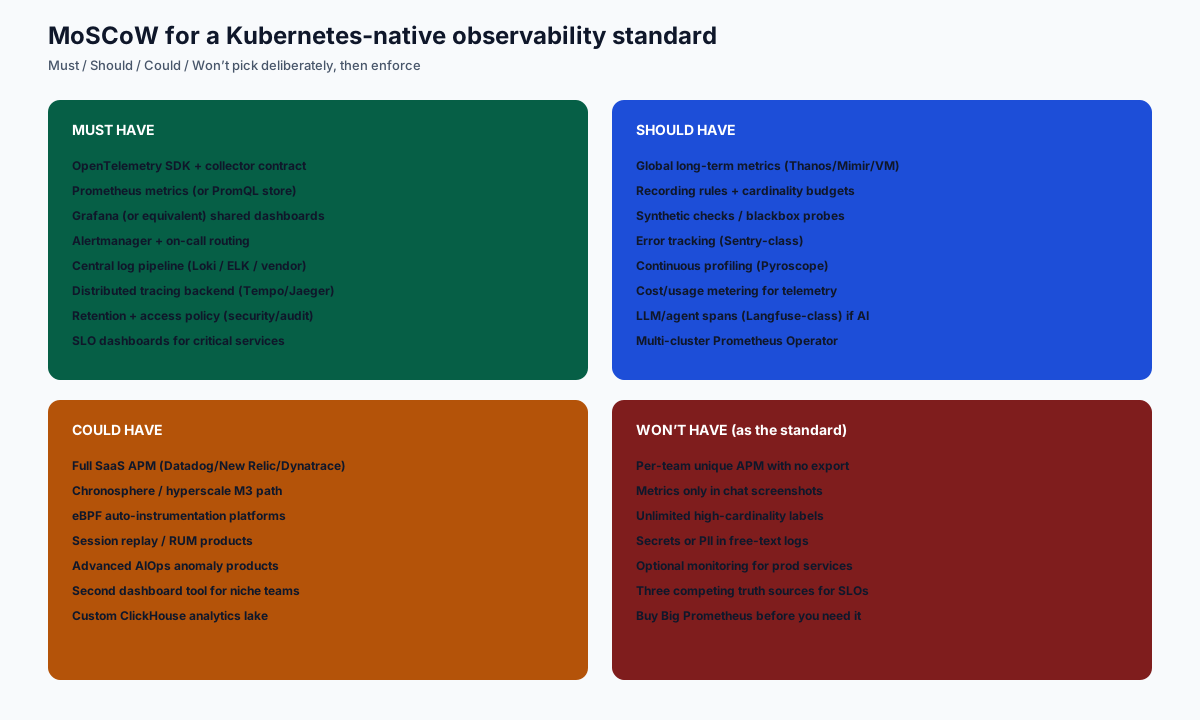
Scope: a Kubernetes-native product company standardising observability across many services (including AI agents). MoSCoW is for the standard, not a shopping list to install on day one.
| Tool / capability | MoSCoW | Role in the standard | Notes |
|---|---|---|---|
| OpenTelemetry | Must | Vendor-neutral telemetry contract | SDKs + Collector; refuse proprietary-only emitters |
| Prometheus | Must | Per-cluster metrics unit | Operator / kube-prometheus-stack |
| Grafana | Must | Shared visualisation | Folder + datasource governance |
| Alertmanager | Must | Alert routing / silence | Pair with PagerDuty/Opsgenie/etc. |
| Logs (Loki or ELK/OpenSearch) | Must | Central structured logs | Pick one primary; ban log-in-Slack |
| Traces (Tempo / Jaeger) | Must | Distributed tracing store | Sampling policy required |
| Fluent Bit / Vector | Must | Log/ship agents | Prefer one agent family |
| Thanos / Mimir / VictoriaMetrics | Should | Global + long-term metrics | When multi-cluster pain is real |
| Recording rules + cardinality budgets | Should | Cost and query hygiene | Enforce in CI / admission |
| Blackbox / synthetics | Should | User-path probes | Critical journeys only first |
| Sentry-class errors | Should | Exception intelligence | Link to traces via IDs |
| Pyroscope / profiling | Should | Continuous profiling | CPU/mem hotspots in prod |
| Langfuse / LLM observability | Should* | Agent/LLM spans & cost | *Must if you ship AI agents |
| Datadog / New Relic / Dynatrace | Could | Full SaaS APM | OK if OTEL export + FinOps caps |
| Chronosphere / M3 path | Could | Hyperscale metrics SaaS/OSS | Buy when scale justifies |
| eBPF auto-platforms | Could | Low-touch signals | Supplement, don’t replace SLOs |
| RUM / session replay | Could | Front-end experience | Privacy review required |
| Per-team proprietary APM w/ no export | Won’t | Breaks the standard | Creates unmergeable truths |
| Unlimited cardinality / raw everything | Won’t | Budget killer | Policy + CI gates |
| Optional prod monitoring | Won’t | Governance failure | Release blocker instead |
4. Reference architecture (Workstation-shaped)
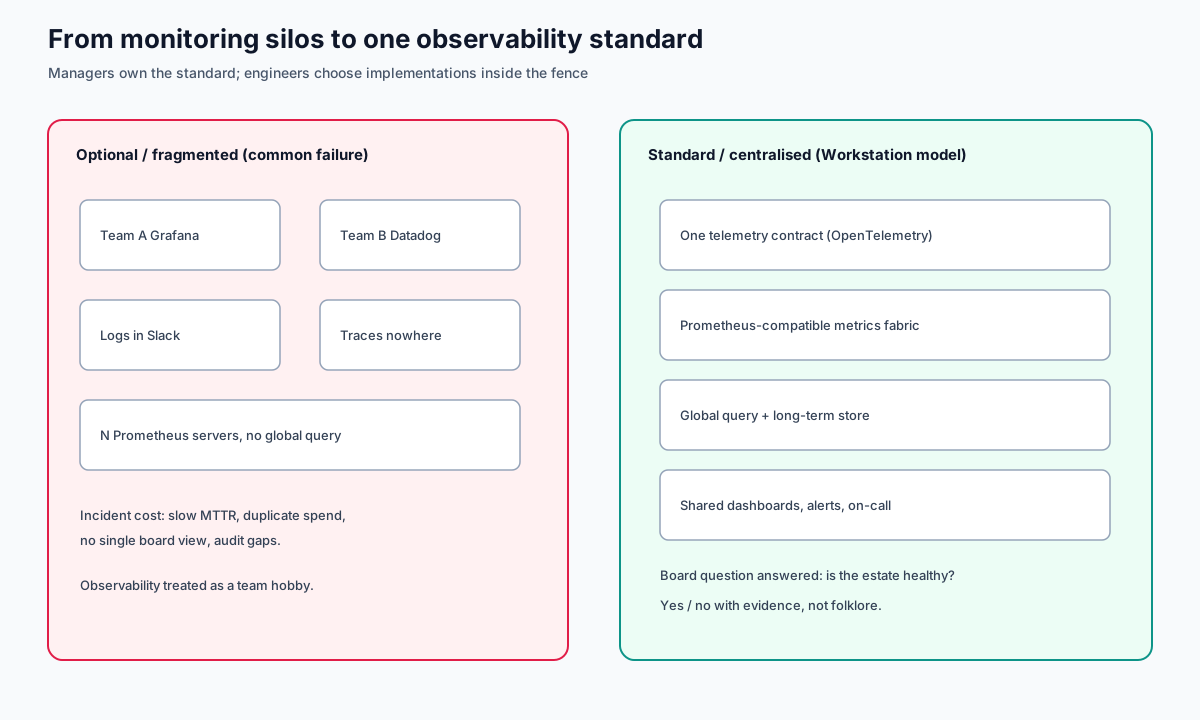
- Emit — Apps and agents use OpenTelemetry; metrics also expose Prometheus endpoints where natural.
- Collect — OTEL Collector + Prometheus scrape; Fluent Bit/Vector for logs.
- Store local — Prometheus per cluster (short retention) for independence.
- Store global — Thanos or Mimir or VictoriaMetrics when multi-cluster query/retention demands it.
- Correlate — Grafana explores metrics + Loki/ELK logs + Tempo/Jaeger traces with shared trace IDs.
- Act — Alertmanager → on-call; SLOs on golden journeys (checkout, agent reply, edge 5xx).
- Govern — Cardinality budgets, sampling, retention classes (hot/warm/cold), access control, audit.
5. When SaaS is the right “Big Prometheus”
Paying Datadog, Grafana Cloud, Chronosphere, New Relic, or Dynatrace is often rational: you are buying an ops team and a multi-tenant store. The standard still applies — insist on OpenTelemetry instrumentation, exportability, and cost controls. Many SaaS backends are themselves descendants of Cortex/Mimir/Thanos-class thinking. Buying does not excuse siloed optional monitoring.
6. Decision checklist
- Do we have a written observability standard (Must/Should/Could/Won’t)?
- Can we answer global health questions without five UIs?
- Is production release blocked without golden signals?
- Do we know monthly telemetry cost and top cardinality offenders?
- Have we measured the pain that justifies Thanos/Mimir/VM/M3 — or are we fashion-shopping?
7. Related Workstation reading
- Manager blog — observability as a business standard
- LLM bottlenecks, OpenTelemetry, and cost control · technical brief
- Ring Promoter — every release earns production (promotion health pairs with observability)
- Source inspiration: Big Prometheus — Monitoring Monitoring (Clay Smith, 2020)
Published by Workstation — centralise the signals, standardise the stack, and only then scale the metrics database.