NVIDIA UFM for AI Clusters: Why InfiniBand Fabric Visibility Decides What Your GPUs Are Worth
The three UFM tiers, three real-world cluster shapes, and how Workstation supplies, sets up and runs the monitoring
 Balinder WaliaNovember 9, 202612 min read
The GPUs get the attention and the budget. The network that joins them decides how much of that budget turns into useful work. This post is for IT directors, CTOs and heads of research computing running or buying an NVIDIA InfiniBand cluster. It explains, in plain terms, what NVIDIA Unified Fabric Manager (UFM) does, which of its three tiers fits which cluster, what better fabric visibility is worth in GPU hours, and how Workstation supplies, sets up and runs the monitoring for you. Engineers who want the plugins, the OpenTelemetry configuration and the alert rules should read the technical article.
Interactive version: open seventeen example dashboards, from fabric health to cost per GPU-hour, with the queries and alert thresholds behind each one.

Why the fabric decides what your GPUs are worth
Training a large model, or serving one across several servers, is a team sport for GPUs. Every few milliseconds they stop and exchange results with each other over the network. The job can only move as fast as the slowest exchange. If one link out of several hundred is running with errors, retrying packets or quietly dropping to a lower speed, every GPU in that job waits for it.
That is what makes AI networking different from office networking. On a normal network, a slow link annoys a few users. On an AI fabric, a slow link turns a 256-GPU job into a 256-GPU queue. And the symptom does not look like a network problem. It looks like "training is slower this week", or "the GPUs are only at 60%". Teams then spend days tuning software that was never the cause.
The maths is simple enough to put in front of a finance director. Take a cluster of 256 GPUs and give each GPU-hour a fully loaded cost of £2.50 (hardware depreciation, power, cooling, space and support; your figure will differ). That cluster represents about 2.24 million GPU-hours a year:
- Losing 1% of utilisation to fabric problems costs about £56,000 a year.
- One flapping link that stalls a 256-GPU training run for three hours before anyone notices costs about 770 GPU-hours, or £1,900, plus the restart from the last checkpoint.
- A failing transceiver replaced in a planned window instead of mid-run saves the same again, and the weekend call-out.
These are illustrative figures, but the shape is always the same: the cost of watching the fabric properly is small compared with the GPU time it protects.
What NVIDIA UFM is, in plain terms
InfiniBand is the network most large AI and HPC clusters use between GPU servers, because it is fast, predictable and offloads a lot of work from the servers. Every InfiniBand fabric needs a subnet manager, the software that discovers every switch and adapter, works out routes and keeps the fabric running. NVIDIA Unified Fabric Manager is NVIDIA's software for running and watching that fabric at data-centre scale.
Think of it as three jobs in one product family: NVIDIA describes the full platform on its official UFM page.
- See it. Collect counters from every switch port, adapter and cable: traffic, errors, retries, temperatures, link speeds. Show them live and keep history.
- Run it. Discover the topology, manage the subnet manager, carve the fabric into isolated partitions for different teams or customers, apply firmware and configuration consistently, and raise events and alarms.
- Predict it. Learn what normal looks like for your fabric and flag the cable that is getting worse, or the traffic pattern that does not fit, before it fails.
UFM also has an open software development kit with plugins that send its data to the tools your operations team already uses: Prometheus and Grafana, Elasticsearch via Fluentd, Zabbix, syslog, and the Slurm job scheduler. That matters, because nobody wants another screen to watch. We cover the plugins in detail in the technical article.
The three UFM tiers and when each fits
NVIDIA packages UFM in three main tiers. The names describe what each adds:
| Tier | What it adds | Fits best when | Watch out for |
|---|---|---|---|
| UFM Telemetry | Real-time collection of fabric counters and cable data, streamed out to your own monitoring tools. Visibility only. | Smaller clusters where the subnet manager already runs on a switch, or teams that just need fabric data in Grafana. | No partition management, no central fabric control and no high-availability pair. |
| UFM Enterprise | Everything in Telemetry, plus full fabric management: discovery, topology views, subnet manager control, partitions, events and alarms, health reports, a REST API, scheduler integration and an active/standby HA pair. | Most production AI clusters, anything shared between teams or tenants, and any cluster running Slurm. | Needs dedicated management servers (or NVIDIA's appliance), and someone who owns it. |
| UFM Cyber-AI | Analytics on top of Enterprise telemetry history: learns each fabric's normal behaviour, predicts failing links and cables, and flags anomalies in performance or usage. | Large fabrics with thousands of cables, where predicting failures pays for itself, and providers selling GPU capacity who need to spot misuse. | Its value grows with fabric size and history; on a single-switch cluster it is usually more than you need. |
Exact features, licensing and appliance options change between UFM releases, so we confirm the current packaging with NVIDIA for every quote. The decision logic, though, is stable: Telemetry if you only need to see the fabric, Enterprise if you need to run it, Cyber-AI if the fabric is big enough that predicting failures saves real money.
Three clusters, three answers
1. A four-node DGX B300 or HGX B300 cluster
Four eight-GPU servers, 32 GPUs, used by one AI team for fine-tuning and inference. Each server has eight 800 Gb/s network adapters for the GPU fabric, so there are 32 compute ports, which fit on a single InfiniBand switch.
- Our usual recommendation: run the subnet manager on the switch and use UFM Telemetry to feed fabric counters into the same Grafana that shows GPU utilisation. If the cluster will later grow or be shared, start with UFM Enterprise so the partitioning and history are already in place.
- Business outcome: one dashboard shows GPUs and network together. When a job slows down, the team can see within minutes whether a GPU, a server or a port is to blame, instead of opening a support case and waiting.
- Example: a fine-tuning job's throughput dips by a fifth every afternoon. The fabric panel shows rising error-recovery counts on one port as the room warms up. The cause is a transceiver that is sensitive to temperature; it is swapped under warranty before it fails outright.
2. A 32-node SuperPOD-style cluster
Thirty-two eight-GPU servers, 256 GPUs, built on NVIDIA's reference design with separate network rails, leaf and spine switches and well over a thousand optical links. Several teams train large models on it, and some jobs use every GPU at once.
- Our usual recommendation: UFM Enterprise in an HA pair, with partitions per team, the problem-detection plugin enabled first in dry-run mode, and the telemetry flowing into central monitoring. Evaluate UFM Cyber-AI once there are a few months of history: at this size, a handful of failing cables a quarter is normal, and predicting them is worth money.
- Business outcome: faults that used to surface as "the big job is slow" become a ticket that says which cable, which rack and which jobs crossed it. Maintenance moves from emergency to scheduled.
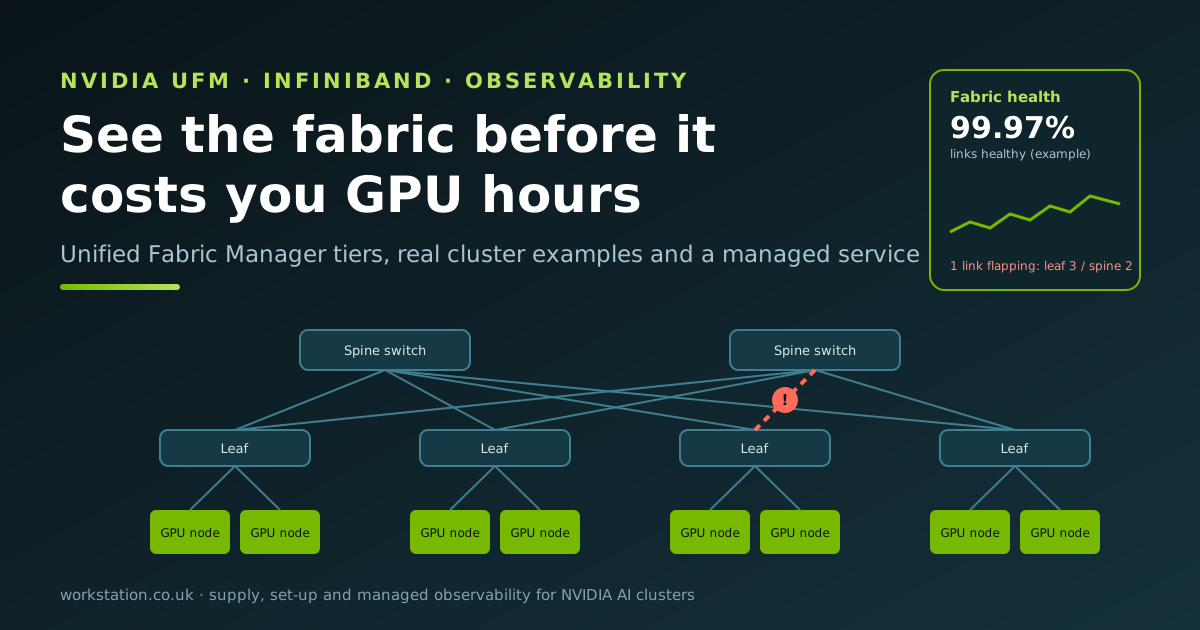
- Example: a link between a leaf and a spine starts to flap twice an hour. Alerting pages the on-call engineer in about five minutes, UFM's problem-detection plugin isolates the port so traffic routes around it, and the 256-GPU job carries on at a fraction of a percent lower bandwidth instead of stalling. The cable is replaced the next morning.
3. A university HPC service with Slurm
A shared research cluster: a few generations of GPU nodes, a large pool of CPU nodes, a parallel file system and hundreds of users across departments, all scheduled through Slurm.
- Our usual recommendation: UFM Enterprise with NVIDIA's Slurm integration, which can give each job its own fabric partition while it runs, so jobs from different groups are isolated on the network as well as on the servers. GPU metrics are tagged with the Slurm job ID, so usage can be traced to a job, a user and a department.
- Business outcome: fair, evidence-based reporting. The research computing team can show each department its GPU hours, how efficiently they were used and whether slow jobs were the code or the infrastructure. That makes funding bids, chargeback and capacity planning much easier.
- Example: a PhD student reports that their eight-node job is "always slow on Tuesdays". The job view shows their nodes share a leaf switch with a weekly data-ingest job that saturates its uplinks. The fix is a scheduler constraint, not new hardware.
What good fabric visibility gives you
- Higher GPU utilisation, because network faults are found in minutes, not days, and jobs are not left waiting on one bad port.
- Fewer failed long runs, because failing cables and transceivers are spotted and replaced in planned windows.
- Faster, calmer incidents, because GPU, server, network and job data sit on one timeline, so the first question ("is it the network?") gets answered with evidence.
- Clean multi-tenancy, because partitions and per-job isolation are managed and audited centrally.
- Honest capacity and cost reporting, because you can show cost per useful GPU-hour, by team, rather than cost per installed GPU.
- Stronger warranty and support cases, because you can hand the vendor the counters, timestamps and history for a faulty part instead of a description.
Monitor the whole stack, not just the fabric
UFM covers the InfiniBand fabric. A working AI cluster also needs visibility of the GPUs (NVIDIA's Data Center GPU Manager, DCGM), the Ethernet networks for storage and front-end traffic (NVIDIA Spectrum-X and NetQ), BlueField data processing units if you use them, the servers, the scheduler and the AI services themselves. In our earlier post on observability as a business standard we argued that monitoring should be one company-wide contract, not a set of team preferences. The same applies here: fabric data belongs in the same system as everything else, labelled the same way, so a single query can follow a slow job from the scheduler to the GPU to the switch port.
Our standard design uses OpenTelemetry to collect everything once and send it to two kinds of backend: Prometheus-compatible metrics with Grafana (we use Grafana Mimir for long-term, highly available storage, and Grafana Tempo for request traces), and the Elastic stack (Elasticsearch and Kibana) for logs and events, because many organisations already run it. If you have already standardised on one of them, we plug into what you have.
What Workstation does
We are a UK reseller and integrator of NVIDIA AI infrastructure, and we run managed observability for customers. For a UFM-managed cluster that means three things:
- Supply. GPU servers (DGX and HGX B300 systems and others), InfiniBand and Ethernet switches, adapters, cables and transceivers, and the UFM licences at the right tier, specified together so the fabric matches the GPUs. You can browse DGX systems, networking and NVIDIA software in our shop.
- Set up. We install UFM (in an HA pair where it fits), configure partitions and the Slurm or Kubernetes integration, deploy DCGM and the OpenTelemetry collectors, and hand over dashboards and alert rules that have been tested against real faults: we pull a cable and show you the page arrive.
- Run it for you. Our managed observability service keeps the monitoring stack itself healthy and highly available, tunes alerts so they are worth waking up for, watches fabric and GPU health around the clock, and sends you a monthly report on utilisation, faults and capacity. We work alongside your team and NVIDIA support, not instead of them.
Questions to ask before you buy
- Who will own the fabric day to day, and do they need to run it or just see it?
- Will the cluster be shared between teams, departments or customers? If so, how will they be isolated on the network?
- Which scheduler do you use, and do you want GPU and fabric usage reported per job and per team?
- Where should the monitoring data live, and for how long? Do you already run Prometheus, Grafana or Elastic?
- What does an hour of your cluster cost, and how quickly do you need to know when it is being wasted?
NVIDIA partner: engineering, software and people
Workstation is an NVIDIA partner. Beyond supplying the hardware, we provide the engineering, software and staff to plan, build and run AI data centres: site and power surveys, rack and fabric design, InfiniBand and Spectrum-X installation, UFM, DCGM and OpenTelemetry set-up, Kubernetes and Slurm onboarding, and engineers who stay with you through handover and managed support. For NVIDIA's own description of the platform, see the official NVIDIA Unified Fabric Manager (UFM) page (opens in a new tab).
Next steps
Open the interactive dashboard gallery to see the seventeen views we build for a typical cluster, from fabric health to cost per GPU-hour. Then ask our AI Sales Engineer to size a cluster, a fabric and the right UFM tier for your workloads, or browse the Workstation shop for HGX B300 servers and DGX BasePOD configurations. We are happy to start with an observability review of a cluster you already own.
Figures in this post are illustrative examples, not measurements from a specific customer.
Acknowledgement of rights: NVIDIA, the NVIDIA logo, DGX, HGX, Quantum, Spectrum, Spectrum-X, BlueField, ConnectX, NVLink, DOCA, DCGM and Unified Fabric Manager (UFM) are trademarks and/or registered trademarks of NVIDIA Corporation in the United States and other countries. NVIDIA products and technologies may be covered by patents and other intellectual property rights owned by NVIDIA Corporation, and all such rights are acknowledged and reserved to their owners. Product information is summarised in our own words from NVIDIA's public documentation; NVIDIA's website and documentation are the authoritative source. Other company and product names, including Prometheus, Grafana, Elasticsearch, Kibana, Logstash, OpenTelemetry, Kubernetes and Slurm, may be trademarks of their respective owners. Workstation's own dashboards, configurations and text are © Workstation.