Technote · for platform, network and HPC engineers
NVIDIA Observability with OpenTelemetry: UFM SDK Plugins, DCGM, DOCA and NetQ into Mimir, Grafana and the Elastic Stack
A practitioner's guide to NVIDIA's observability tooling for AI clusters and how we join it up with OpenTelemetry. It covers UFM and its open SDK plugins, the UFM REST API and telemetry endpoints, DCGM and dcgm-exporter for GPUs (including the metric renames in dcgm-exporter 4.9.0), DOCA Telemetry Service on BlueField, NetQ for Spectrum-X Ethernet, and Workstation's reference design: an OpenTelemetry Collector agent on every node, a gateway pair, and two backends (Prometheus-compatible metrics in Grafana Mimir with Grafana and Tempo, and the Elastic stack). Working configuration, alert rules, a labelling scheme, cardinality sums and the high-availability design for the monitoring itself are included. The business case is in the companion blog post.
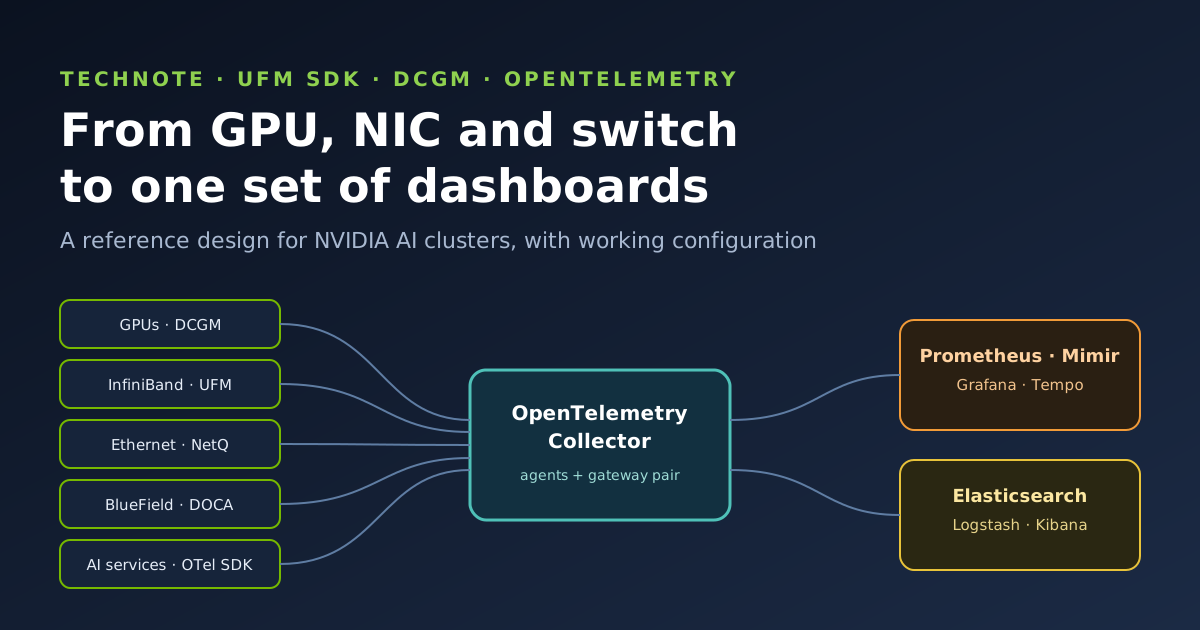
Summary. Collect each signal once, as close to its source as is sensible, label it with one fleet-wide scheme, and fan it out to the backends people already use. GPU counters come from DCGM, InfiniBand fabric counters and events from UFM, Ethernet fabric data from NetQ or the switches, DPU counters from DOCA Telemetry Service, and request traces from the AI services through the OpenTelemetry SDK. OpenTelemetry Collectors do the labelling, filtering, sampling and routing. Metrics and traces go to Mimir and Tempo, logs and events go to Elasticsearch, and the whole pipeline is itself monitored and highly available.
This article follows the stance of our earlier Big Prometheus and MoSCoW technote: OpenTelemetry is the telemetry contract, Prometheus semantics and PromQL are the metrics language, and a horizontally scalable store (here Grafana Mimir) is used once a single Prometheus no longer answers fleet-wide questions. The one thing we add for AI clusters is a second backend for logs, because the Elastic stack is so often already in place for security and operations teams. Logs go to one primary store, as that article recommends; we do not write the same logs twice.
1. The signals that matter in an AI cluster
An AI cluster fails in layers. A useful monitoring design names each layer, the NVIDIA tool that knows about it, and how the data leaves that tool.
| Layer | Typical faults | NVIDIA source | How we collect it |
|---|
| GPU and NVLink | XID errors, ECC and row-remap events, thermal or power throttling, NVLink errors, idle GPUs in running jobs | DCGM (host engine) and dcgm-exporter | Prometheus scrape on the node by the Collector agent |
| InfiniBand compute and storage fabric | Link flaps, symbol and integrity errors, links trained at the wrong speed or width, congestion, hot or failing transceivers, subnet manager changes | UFM Telemetry and UFM Enterprise (events, alarms, topology, REST API), SDK plugins | Prometheus scrape of UFM telemetry; UFM events by syslog or Fluentd; REST polling for topology |
| Ethernet fabric (Spectrum-X, storage and front end) | Drops, PFC storms, ECN marking, RoCE congestion, BGP or EVPN changes | NetQ; switch streaming telemetry | NetQ API or switch gNMI or OTLP streaming into the gateway |
| BlueField DPU | Port and offload counters, DPU health | DOCA Telemetry Service | Scrape of its Prometheus-format endpoint |
| Host and storage clients | Memory pressure, NVMe wear, file-system latency, NIC errors | (standard Linux tooling) | node-exporter, filelog and journald receivers |
| Scheduler and orchestration | Jobs stuck, nodes drained, GPU requests with no utilisation | (Slurm, Kubernetes), UFM Slurm integration | Job-to-GPU labels from dcgm-exporter; scheduler exporters; Kubernetes metadata |
| AI services | Slow time to first token, queueing, errors, token throughput drops | (model servers such as NIM, Triton or vLLM) | OpenTelemetry SDK traces and metrics over OTLP |
2. NVIDIA UFM: tiers, telemetry endpoints and REST API
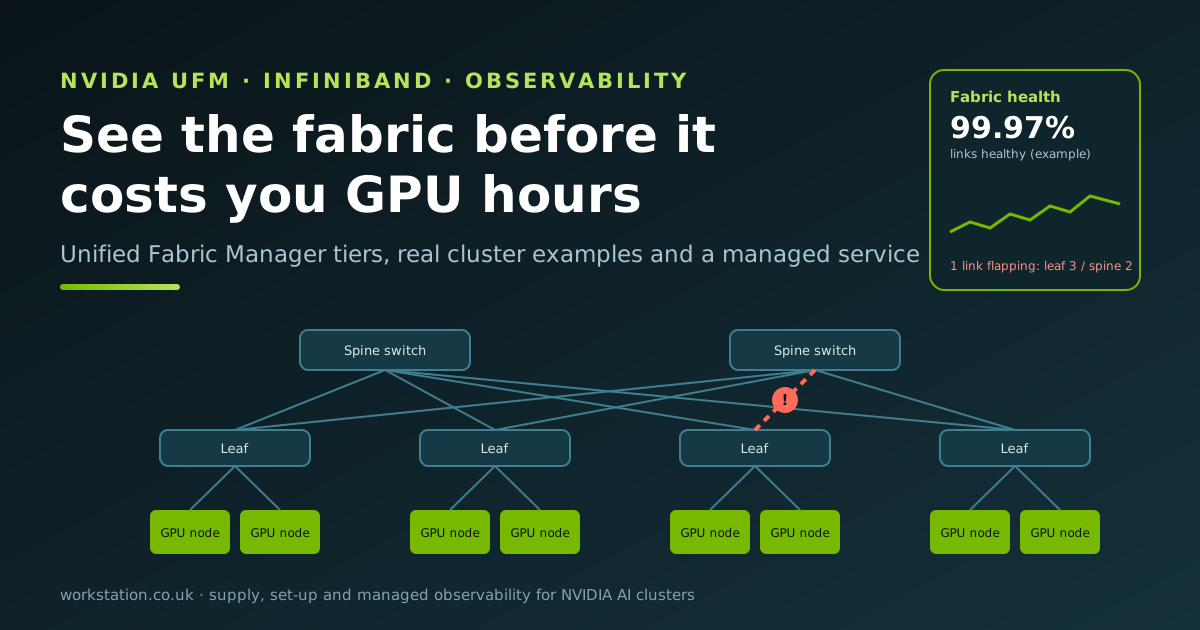
Unified Fabric Manager (see the official NVIDIA UFM page) runs and observes InfiniBand fabrics. It comes in three tiers that build on each other:
- UFM Telemetry samples performance and error counters from every port in the fabric, together with cable and transceiver data, and exposes or streams them. It is a visibility layer only.
- UFM Enterprise adds fabric management: discovery and topology, subnet manager control, partition key (PKey) management, events and alarms, health and topology reports, the REST API, integrations with schedulers and cluster managers, and an active/standby high-availability pair.
- UFM Cyber-AI applies analytics and machine learning to the Enterprise telemetry history to predict failing links and cables and to flag performance or usage anomalies.
Telemetry endpoints
UFM's telemetry service serves its counters over HTTP, by default on port 9001. There is a CSV view (for example /csv/metrics, plus counter-set views such as /csv/xcset/ib_basic_debug) and, when Prometheus label generation is enabled, a Prometheus endpoint whose path the SDK documentation gives as labels/enterprise. Counter-set views accept sharding parameters (num_shards, shard, sharding_field=port_guid), which helps when a single request for a large fabric is too big to answer within a scrape interval.
Counter names follow the InfiniBand performance-management attributes. The ones we have confirmed in NVIDIA's own SDK material, and which we build on below, are:
| Counter | What it tells you |
|---|
PortXmitDataExtended, PortRcvDataExtended | Data sent and received on the port; rate it for bandwidth (NVIDIA's own Grafana dashboard multiplies the rate by 8 to show bits per second) |
LinkDownedCounterExtended | Times the link went down: the link-flap signal |
LinkErrorRecoveryCounterExtended | Times the link retrained to recover from errors: often the first sign of a marginal cable |
LocalLinkIntegrityErrorsExtended | Local physical errors exceeding the integrity threshold |
ExcessiveBufferOverrunErrorsExtended | Consecutive buffer overruns on the port |
Normalized_CBW | A congestion bandwidth figure UFM exposes; NVIDIA's dashboard plots its maximum by topology level |
dev_temperature | Device temperature |
The exact set and label names depend on the counter set you enable and the UFM version, so always list what your endpoint actually serves before writing rules: curl -s http://<ufm-host>:9001/csv/metrics | head.
REST API
UFM Enterprise's REST API lives under /ufmRest on the UFM server, with sibling prefixes for other authentication methods: /ufmRestV2 (session), /ufmRestV3 (access token) and /ufmRestKrb (Kerberos). Tokens are created with a POST to /app/tokens. For monitoring we use three read-only resources, all of which appear in NVIDIA's SDK examples:
# Current alarms and recent events (use a read-only monitoring account)
curl -sk -u monitor:"$UFM_PASSWORD" https://ufm-vip.obs.internal/ufmRest/app/alarms
curl -sk -u monitor:"$UFM_PASSWORD" https://ufm-vip.obs.internal/ufmRest/app/events

# Every link in the fabric, with both ends: the basis of our node-to-switch-port map
curl -sk -u monitor:"$UFM_PASSWORD" https://ufm-vip.obs.internal/ufmRest/resources/links

# UFM's own health in Prometheus format (scrape every few minutes, not seconds)
curl -sk -u monitor:"$UFM_PASSWORD" https://ufm-vip.obs.internal/ufmRest/system_monitoring/metrics
We wrap the links call in a small exporter that publishes an info metric, ws_ib_link_info{node, hca_port, switch, port}, every five minutes. That metric is what lets a query walk from a Slurm job to its GPUs to the exact switch ports its traffic crosses. It is our convention, not an NVIDIA metric.
High availability
UFM Enterprise runs as an active/standby pair managed by its HA tooling (ufm_ha_cluster), with configuration replicated between the two servers and a virtual IP that moves on failover. Point every scrape, REST client and syslog destination at the virtual IP, never at a node. Where a plugin is used in HA, NVIDIA's instructions are to load its container image on the standby node as well, so it is ready after failover.
3. The UFM SDK and its plugins
NVIDIA publishes an open SDK for UFM at github.com/Mellanox/ufm_sdk_3.0. Most of it is a set of plugins: containers that UFM manages through its plugin manager (from the web UI, or with /opt/ufm/scripts/manage_ufm_plugins.sh add -p <name> on a standalone or HA install). Here is what each one does and how it fits our design.
| Plugin | What it does | Where it fits |
|---|
grafana_infiniband_telemetry_plugin | Serves a second Prometheus endpoint (port 8982, path /labels/enterprise) with human-readable labels such as device names instead of GUID-based labels, and ships a sample Grafana dashboard. | Our preferred scrape target for fabric counters: readable labels mean fewer relabelling rules. |
grafana_telemetry_plugin | Instructions and a dashboard for scraping UFM Telemetry's own Prometheus endpoint (port 9001) directly. | Use when you cannot run the plugin above; expect GUID-based labels. |
grafana_ufm_monitoring_plugin | A dashboard for UFM's own system health, scraped from /ufmRest/system_monitoring/metrics over HTTPS with basic authentication. | Monitors the monitor: CPU, memory and API health of the UFM servers. |
ufm_events_grafana_dashboard_plugin | Parses UFM's event.log with Fluentd, pushes it to a bundled Loki and shows it in a bundled Grafana. | Good for a quick start; in production we send events to the central log store instead. |
fluentd_telemetry_plugin (TFS) | Polls one or more UFM telemetry endpoints at its own interval per endpoint and streams the counters to a Fluentd destination (forward protocol on 24224 by default, or HTTP). Attributes can be enabled, disabled or renamed through its REST API, and it publishes its own streaming statistics in Prometheus format. | The route for fabric counters into Elasticsearch when a customer has standardised on Elastic for metrics as well as logs. |
fluentd_topology_plugin | Extracts topology through the UFM API and streams it over the Fluentd protocol. | Topology snapshots in the log store, so you can see what the fabric looked like at the time of an incident. |
ufm_syslog_streaming_plugin (EFS) | Extracts UFM events from its syslog and streams them to Fluentd (Fluent Bit compatible), and can also copy UFM syslog to a remote syslog server. | Our main route for UFM events and alarms into Elasticsearch. |
zabbix_telemetry_plugin | Instructions for streaming UFM events into Zabbix through the Zabbix agent and log items. | For operations teams that already run Zabbix as their event console. |
SLURM-Integration | Slurm prolog and epilog hooks that call UFM for every job: static or dynamic (per-job, derived from the job ID) partition keys, with UFM managing SHARP reservations automatically from PKey membership. Supports token, basic or Kerberos authentication. UFM must run in management mode, not monitoring-only. | Per-job network isolation and a record of which job used which ports. |
pdr_deterministic_plugin | Problem Detection and Resolution: uses UFM dynamic telemetry to compute bit error rates, temperatures and link-down deltas, isolates ports that cross thresholds, records them, and de-isolates them after a clean test period. Has a dry-run mode and an exclusion list. | Automatic isolation of bad links so jobs route around them; see section 4. |
UFM_NDT_Plugin | Network Design Tool comparison: upload the intended topology, compare it with what UFM discovered, once or on a schedule, and read the reports through the REST API. | Proves the as-built cabling matches the design at handover and after maintenance. |
gnmi_nvos_events_plugin | Subscribes to "on change" system events from NVOS-managed switches over gNMI and turns them into UFM external events. | Brings switch-side events (for example a transceiver reset) into the same UFM event stream. |
snmp_receiver_plugin | Listens for SNMP traps from managed switches and redirects them into UFM as events. | Same idea for switches that only send traps. |
grpc_streamer_plugin | A gRPC server that returns UFM REST data (events, alarms, links and others) once or as a periodic stream, optionally only the changes. NVIDIA marks it as under development. | Not in our production design yet; we watch it as a lower-latency alternative to REST polling. |
ufm_log_analyzer_plugin | Analyses a UFM sysdump or logs offline and produces findings and a PDF report. NVIDIA marks it as under development and for internal use. | Useful for support cases; not part of live monitoring. |
bright_plugin | Connects UFM to Bright Cluster Manager (now NVIDIA Base Command Manager) and pulls node status and job assignments into UFM. | Puts workload context next to network events for root-cause work on BCM-managed clusters. |
Most plugins ship as images on Docker Hub (mellanox/ufm-plugin-*); PDR is downloaded from the NVIDIA Licensing Portal. For air-gapped sites, the SDK documents the usual docker save and docker load route, and we include the images in the offline bundle we stage before shipping.
4. Problem Detection and Resolution in practice
PDR is the plugin that changes operations most, so it deserves its own section. Its configuration file exposes the thresholds directly. The defaults in the SDK at the time of writing are:
| Setting | Default | Meaning |
|---|
INTERVAL | 300 s | How often telemetry counters are requested |
MAX_NUM_ISOLATE | 10 | Upper bound on isolated ports (the larger of this and 0.5% of fabric size) |
TMAX / D_TMAX | 70 °C / 10 | Maximum temperature and maximum temperature rise |
MAX_PDR | 1e-12 | Maximum packet drop rate |
CONFIGURED_BER_CHECK, CONFIGURED_TEMP_CHECK, LINK_DOWN_ISOLATION | True | Which checks may trigger isolation |
SWITCH_TO_HOST_ISOLATION | True | Whether access links to hosts may be isolated |
DRY_RUN | False | Log decisions instead of acting |
DEISOLATE_CONSIDER_TIME | 5 min | How long a port must look healthy before it is returned to service |
MAX_PORT_RESET_NUM | 2 per week | Port resets allowed before a reset window clears |
Its bit-error-rate check watches symbol errors over short and long windows (about 12 and 125 minutes), which is why it catches cables that are degrading rather than only those that have failed. Our rollout is always the same:
- Enable with
DRY_RUN=True for two to four weeks and ship its log to Elasticsearch. Every "would isolate" line becomes a ticket we review against UFM counters.
- Agree the exclusion list (ports PDR must never touch, such as single-homed storage links) through the plugin's REST API.
- Switch to live isolation, with
SWITCH_TO_HOST_ISOLATION decided per site: isolating a host link removes that node from jobs, which is sometimes what you want and sometimes not.
- Alert on every isolation and de-isolation, and create a maintenance ticket for the physical fix.
5. GPU telemetry: DCGM and dcgm-exporter
NVIDIA Data Center GPU Manager (DCGM) is the GPU health and telemetry service; dcgm-exporter turns its fields into Prometheus metrics, by default on port 9400. On Kubernetes it is normally deployed by the NVIDIA GPU Operator; on Slurm clusters we run it as a systemd service or container next to the DCGM host engine.
dcgm-exporter 4.9.0 renamed the default metrics
Release 4.9.0 (November 2026) renames the default and profiling fields to their DCGM 4.7 names, and eleven of them change unit: clocks to hertz, energy to joules, utilisation from a percentage to a 0 to 1 ratio, memory from MiB to bytes, and NVLink throughput to bytes per second. Dashboards and alerts written for 4.8.x will silently go blank, or worse, compare a ratio with a percentage. The defaults we use most:
| 4.8.x name | 4.9.0 name | Unit change |
|---|
DCGM_FI_DEV_GPU_UTIL | DCGM_FI_DEV_GPU_UTIL_RATIO | % to 0–1 |
DCGM_FI_DEV_FB_USED | DCGM_FI_DEV_FB_USED_BYTES | MiB to bytes |
DCGM_FI_DEV_GPU_TEMP | DCGM_FI_DEV_GPU_TEMP_CELSIUS | none |
DCGM_FI_DEV_POWER_USAGE | DCGM_FI_DEV_BOARD_POWER_WATTS | none |
DCGM_FI_DEV_TOTAL_ENERGY_CONSUMPTION | DCGM_FI_DEV_GPU_ENERGY_JOULES_TOTAL | mJ to J |
DCGM_FI_DEV_XID_ERRORS | DCGM_FI_DEV_XID_ERROR | none (last XID value) |
DCGM_FI_DEV_NVLINK_BANDWIDTH_TOTAL | DCGM_FI_DEV_NVLINK_THROUGHPUT_BYTES_PER_SECOND | MB/s to B/s |
DCGM_FI_DEV_UNCORRECTABLE_REMAPPED_ROWS | DCGM_FI_DEV_ROW_REMAP_UNCORRECTABLE_TOTAL | none |
DCGM_FI_DEV_ROW_REMAP_FAILURE | DCGM_FI_DEV_ROW_REMAP_FAILED | none |
DCGM_FI_DEV_PCIE_REPLAY_COUNTER | DCGM_FI_DEV_PCIE_REPLAY_TOTAL | none |
DCGM_FI_PROF_GR_ENGINE_ACTIVE | DCGM_FI_PROF_GR_ENGINE_UTIL_RATIO | none (ratio) |
DCGM_FI_PROF_PIPE_TENSOR_ACTIVE | DCGM_FI_PROF_TENSOR_UTIL_RATIO | none (ratio) |
DCGM_FI_PROF_DRAM_ACTIVE | DCGM_FI_PROF_DRAM_UTIL_RATIO | none (ratio) |
The driver-version label also changes, from DCGM_FI_DRIVER_VERSION to DCGM_FI_SYSTEM_DRIVER_VERSION. Read NVIDIA's upgrade checklist before upgrading. During a mixed-version rollout we bridge the two with recording rules, so dashboards only ever query the ws: names:
groups:
  - name: dcgm-bridge
    rules:
      - record: ws:gpu_util:ratio
        expr: DCGM_FI_DEV_GPU_UTIL_RATIO or (DCGM_FI_DEV_GPU_UTIL / 100)
      - record: ws:gpu_fb_used:bytes
        expr: DCGM_FI_DEV_FB_USED_BYTES or (DCGM_FI_DEV_FB_USED * 1048576)
      - record: ws:gpu_power:watts
        expr: DCGM_FI_DEV_BOARD_POWER_WATTS or DCGM_FI_DEV_POWER_USAGE
Every example in the rest of this article uses the 4.9.0 names.
Which GPU metric means "busy"?
DCGM_FI_DEV_GPU_UTIL_RATIO only says that a kernel was running during the sample; a GPU waiting on the network inside a collective can still read close to 1. For efficiency reporting we use the profiling fields: DCGM_FI_PROF_GR_ENGINE_UTIL_RATIO and DCGM_FI_PROF_TENSOR_UTIL_RATIO. They need DCGM's profiling module and can conflict with other profilers such as Nsight Compute on the same GPU, so we pause profiling metric collection when engineers profile by hand.
Job and pod labels
On Kubernetes, dcgm-exporter adds namespace, pod and container labels for the workload using each GPU. On Slurm, its HPC job mapping reads a directory of per-GPU files that a Slurm prolog writes and the epilog clears, and adds an hpc_job label. Version 4.9.0 hardens this (it rejects symbolic links in the mapping directory and limits file and job-ID sizes), and renames any pod label called hpc_job so the two do not clash.
NVLink and NVSwitch
Inside an HGX or DGX B300 system, GPUs talk over NVLink through NVSwitch. The default set gives total NVLink throughput per GPU; the NVLink error counters are optional and differ by GPU generation, so we enable the right ones in the counters CSV: on Blackwell systems such as B300, the recovery counters (DCGM_FI_DEV_NVLINK_RECOVERY_EVENT_TOTAL, DCGM_FI_DEV_NVLINK_RECOVERY_SUCCESSFUL_TOTAL and DCGM_FI_DEV_NVLINK_RECOVERY_FAILED_TOTAL); on Hopper, the data-link counters (DCGM_FI_DEV_NVLINK_CRC_ERROR_TOTAL, DCGM_FI_DEV_NVLINK_REPLAY_TOTAL, DCGM_FI_DEV_NVLINK_RECOVERY_TOTAL). The older …_CRC_FLIT_ERROR_TOTAL and …_REPLAY_ERROR_TOTAL fields apply only to pre-Hopper GPUs. Rack-scale NVL72 systems add an NVLink switch fabric between trays with its own management software, and we treat it as a separate fabric in the labelling scheme.
6. BlueField DPUs and Spectrum-X Ethernet
DOCA Telemetry Service (DTS) runs as a container on BlueField DPUs (and can run on hosts with ConnectX adapters). It gathers counters from the DPU and its ports through a set of providers and exposes them, among other options, on a Prometheus-format endpoint. We scrape that endpoint from the fabric collector with a file-based target list of DPU management addresses, and label each DPU with the host it serves.
NetQ is NVIDIA's monitoring and validation tool for Ethernet fabrics built on Cumulus Linux and SONiC, including Spectrum-X. It collects state and counters from agents on the switches, keeps history so you can ask what changed and when, and validates the fabric against its intended configuration. For RoCE-based AI fabrics, the counters that matter most are drops, PFC pause frames, ECN-marked packets and buffer occupancy. There are three practical ways to bring this into the central stack, and we choose per site:
- keep NetQ as the network team's tool and pull summaries and events from its API into the log store;
- stream directly from the switches (gNMI, or OTLP on recent Cumulus Linux releases; check your version's documentation) into the gateway collectors;
- fall back to SNMP and syslog for older switches.
Counter names differ between these paths, so we normalise them into our own recording-rule names (ws:eth_pfc_pause_rx:rate5m, ws:eth_ecn_marked:rate5m, ws:eth_drops:rate5m) and build dashboards only on those.
7. Workstation's OpenTelemetry reference design
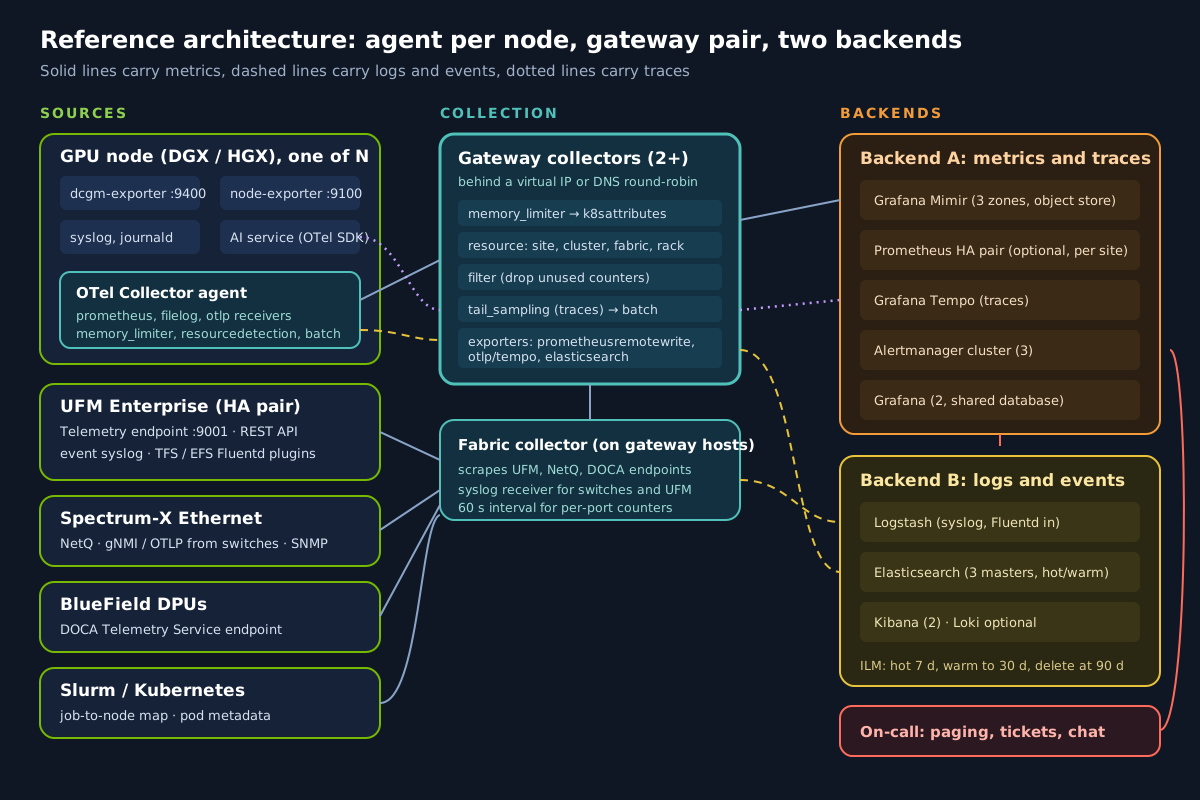
The design has three tiers of Collector:
- An agent on every GPU, storage and login node, running as a systemd service or a Kubernetes DaemonSet. It scrapes local exporters over loopback, tails local logs, receives OTLP from local services, adds host and Kubernetes metadata, and forwards everything to the gateways. It keeps a small persistent queue so a gateway restart loses nothing.
- A gateway pair (or more), behind a virtual IP or DNS name. Gateways apply fleet-wide policy: labels, attribute clean-up, filtering, trace tail sampling, and routing to backends. Credentials for the backends live only here.
- A fabric pipeline on the gateway hosts that scrapes UFM, DOCA and switch endpoints and receives syslog. Both gateways run it; the duplicate samples are removed in Mimir by its HA tracker (section 16).
Why not have every node write straight to the backends? Because the gateway is where policy changes happen once, where secrets stay off hundreds of nodes, and where a backend migration (say, adding Elasticsearch for a security team) is a configuration change on two servers rather than a fleet rollout.
8. Collector agent configuration
This is the agent we deploy on a Slurm GPU node, trimmed only of site-specific certificates. It needs the otelcol-contrib distribution, or a custom build that includes the same components.
# /etc/otelcol-contrib/config.yaml  (agent, one per node)
extensions:
  health_check:
    endpoint: 127.0.0.1:13133
  file_storage:
    directory: /var/lib/otelcol/queue
    create_directory: true

receivers:
  otlp:
    protocols:
      grpc:
        endpoint: 127.0.0.1:4317
      http:
        endpoint: 127.0.0.1:4318

  prometheus:
    config:
      scrape_configs:
        - job_name: dcgm
          scrape_interval: 15s
          static_configs:
            - targets: ["127.0.0.1:9400"]
        - job_name: node
          scrape_interval: 15s
          static_configs:
            - targets: ["127.0.0.1:9100"]
          metric_relabel_configs:
            # keep what the dashboards use; node-exporter's full output is large
            - source_labels: [__name__]
              regex: "node_(cpu_seconds_total|load1|load5|memory_.+|pressure_.+|filesystem_(avail|size)_bytes|disk_(read|written)_bytes_total|network_(receive|transmit)_(bytes|errs|drop)_total|infiniband_.+|hwmon_temp_celsius|nvme_.+|textfile_.+)"
              action: keep

  filelog:
    include:
      - /var/log/syslog
      - /var/log/slurm/slurmd.log
      - /var/log/slurm/ufm_slurm.log
    include_file_path: true
    start_at: end
    storage: file_storage

processors:
  memory_limiter:
    check_interval: 1s
    limit_percentage: 75
    spike_limit_percentage: 20
  resourcedetection:
    detectors: [env, system]
    system:
      hostname_sources: [os]
  resource/fleet:
    attributes:
      - key: site
        value: ${env:WS_SITE}
        action: upsert
      - key: cluster
        value: ${env:WS_CLUSTER}
        action: upsert
      - key: rack
        value: ${env:WS_RACK}
        action: upsert
      - key: node_role
        value: ${env:WS_NODE_ROLE}
        action: upsert
  batch:
    send_batch_size: 8192
    timeout: 5s

exporters:
  otlp/gateway:
    endpoint: otel-gateway.obs.internal:4317
    tls:
      ca_file: /etc/otelcol-contrib/ca.pem
    sending_queue:
      enabled: true
      storage: file_storage
      queue_size: 5000
    retry_on_failure:
      enabled: true
      max_elapsed_time: 30m
  # traces are routed by trace ID so every span of a trace reaches the same
  # gateway, which tail sampling needs
  loadbalancing/traces:
    routing_key: traceID
    protocol:
      otlp:
        tls:
          ca_file: /etc/otelcol-contrib/ca.pem
    resolver:
      dns:
        hostname: otel-gateway-pool.obs.internal
        port: "4317"

service:
  extensions: [health_check, file_storage]
  pipelines:
    metrics:
      receivers: [otlp, prometheus]
      processors: [memory_limiter, resourcedetection, resource/fleet, batch]
      exporters: [otlp/gateway]
    logs:
      receivers: [otlp, filelog]
      processors: [memory_limiter, resourcedetection, resource/fleet, batch]
      exporters: [otlp/gateway]
    traces:
      receivers: [otlp]
      processors: [memory_limiter, resourcedetection, resource/fleet, batch]
      exporters: [loadbalancing/traces]
  telemetry:
    metrics:
      level: detailed
      readers:
        - pull:
            exporter:
              prometheus:
                host: 0.0.0.0
                port: 8888
On Kubernetes nodes we add the k8sattributes processor to the agent (not the gateway, because by the time data reaches a gateway the original pod IP is gone) and filter it to the local node:
processors:
  k8sattributes:
    auth_type: serviceAccount
    filter:
      node_from_env_var: K8S_NODE_NAME
    extract:
      metadata:
        - k8s.namespace.name
        - k8s.pod.name
        - k8s.deployment.name
        - k8s.node.name
      labels:
        - tag_name: tenant
          key: workstation.co.uk/tenant
          from: namespace
9. Gateway configuration and the two backends
The gateway receives OTLP from agents, runs the fabric scrapes and syslog, and exports to both backends. There are two metrics pipelines: one for data forwarded from agents (unique, so no replica label) and one for the fabric scrapes that both gateways run (labelled with the gateway's replica name so Mimir keeps one copy).
# /etc/otelcol-contrib/config.yaml  (gateway, two or more)
extensions:
  health_check:
    endpoint: 0.0.0.0:13133
  file_storage:
    directory: /var/lib/otelcol/queue
    create_directory: true
  basicauth/ufm:
    client_auth:
      username: ${env:UFM_MONITOR_USER}
      password: ${env:UFM_MONITOR_PASSWORD}
  basicauth/es:
    client_auth:
      username: ${env:ES_USER}
      password: ${env:ES_PASSWORD}

receivers:
  otlp:
    protocols:
      grpc:
        endpoint: 0.0.0.0:4317
        tls:
          cert_file: /etc/otelcol-contrib/tls/gateway.crt
          key_file: /etc/otelcol-contrib/tls/gateway.key

  prometheus/fabric:
    config:
      scrape_configs:
        - job_name: ufm-telemetry
          scrape_interval: 60s
          scrape_timeout: 50s
          metrics_path: /labels/enterprise
          static_configs:
            - targets: ["ufm-vip.obs.internal:8982"]
          metric_relabel_configs:
            - source_labels: [__name__]
              regex: "PortXmitDataExtended|PortRcvDataExtended|LinkDownedCounterExtended|LinkErrorRecoveryCounterExtended|LocalLinkIntegrityErrorsExtended|ExcessiveBufferOverrunErrorsExtended|Normalized_CBW|dev_temperature"
              action: keep
        - job_name: ufm-system
          scrape_interval: 4m
          scrape_timeout: 60s
          scheme: https
          metrics_path: /ufmRest/system_monitoring/metrics
          basic_auth:
            username: ${env:UFM_MONITOR_USER}
            password: ${env:UFM_MONITOR_PASSWORD}
          tls_config:
            ca_file: /etc/otelcol-contrib/ufm-ca.pem
          static_configs:
            - targets: ["ufm-vip.obs.internal:443"]
          metric_relabel_configs:
            - source_labels: [__name__]
              regex: "rest_api_response_time_histogram.*"
              action: drop
        - job_name: doca-telemetry
          scrape_interval: 30s
          file_sd_configs:
            - files: ["/etc/otelcol-contrib/targets/dpu-*.yaml"]

  syslog/fabric:
    tcp:
      listen_address: 0.0.0.0:5514
    protocol: rfc5424

processors:
  memory_limiter:
    check_interval: 1s
    limit_percentage: 75
    spike_limit_percentage: 20
  resource/fabric:
    attributes:
      - key: site
        value: ${env:WS_SITE}
        action: upsert
      - key: cluster
        value: ${env:WS_CLUSTER}
        action: upsert
      - key: fabric
        value: ib-compute
        action: upsert
  transform/hygiene:
    error_mode: ignore
    metric_statements:
      - context: datapoint
        statements:
          - delete_key(attributes, "pod_uid")
          - delete_key(attributes, "container_id")
    log_statements:
      - context: log
        statements:
          - delete_key(attributes, "http.request.header.authorization")
  tail_sampling:
    decision_wait: 10s
    num_traces: 100000
    policies:
      - name: keep-errors
        type: status_code
        status_code:
          status_codes: [ERROR]
      - name: keep-slow
        type: latency
        latency:
          threshold_ms: 2000
      - name: baseline
        type: probabilistic
        probabilistic:
          sampling_percentage: 10
  batch:
    send_batch_size: 8192
    timeout: 5s

exporters:
  prometheusremotewrite/mimir:
    endpoint: https://mimir.obs.internal/api/v1/push
    headers:
      X-Scope-OrgID: ${env:WS_TENANT}
    resource_to_telemetry_conversion:
      enabled: true
    remote_write_queue:
      enabled: true
      queue_size: 20000
      num_consumers: 8
    retry_on_failure:
      enabled: true
      max_elapsed_time: 30m
  prometheusremotewrite/mimir-ha:
    endpoint: https://mimir.obs.internal/api/v1/push
    headers:
      X-Scope-OrgID: ${env:WS_TENANT}
    external_labels:
      replica: ${env:WS_GATEWAY_NAME}
    resource_to_telemetry_conversion:
      enabled: true
  otlp/tempo:
    endpoint: tempo-distributor.obs.internal:4317
    tls:
      ca_file: /etc/otelcol-contrib/ca.pem
    sending_queue:
      enabled: true
      storage: file_storage
  elasticsearch/logs:
    endpoints:
      - https://es-hot-1.obs.internal:9200
      - https://es-hot-2.obs.internal:9200
    logs_index: logs-ai.cluster-prod
    # ECS field names, so existing Kibana views and detection rules keep working
    mapping:
      allowed_modes: [ecs]
    auth:
      authenticator: basicauth/es
    tls:
      ca_file: /etc/otelcol-contrib/es-ca.pem

service:
  extensions: [health_check, file_storage, basicauth/ufm, basicauth/es]
  pipelines:
    metrics/forwarded:
      receivers: [otlp]
      processors: [memory_limiter, transform/hygiene, batch]
      exporters: [prometheusremotewrite/mimir]
    metrics/fabric:
      receivers: [prometheus/fabric]
      processors: [memory_limiter, resource/fabric, batch]
      exporters: [prometheusremotewrite/mimir-ha]
    logs:
      receivers: [otlp, syslog/fabric]
      processors: [memory_limiter, transform/hygiene, batch]
      exporters: [elasticsearch/logs]
    traces:
      receivers: [otlp]
      processors: [memory_limiter, tail_sampling, batch]
      exporters: [otlp/tempo]
  telemetry:
    metrics:
      level: detailed
      readers:
        - pull:
            exporter:
              prometheus:
                host: 0.0.0.0
                port: 8888
Notes on choices:
- Scrape interval for fabric counters is 60 seconds. Faster rarely helps: the UFM sample itself, the alert window and human response dominate detection time (see the data-flow figure below), and per-port series are where the volume is.
- The keep list on
ufm-telemetry is the single most effective cost control in the whole design. Start narrow; add a counter when a dashboard or alert needs it.
resource_to_telemetry_conversion turns resource attributes into labels. That is what puts site, cluster, rack and fabric on every series, and it is also how cardinality accidents happen, which is why the agents set only the attributes we want and the hygiene processor removes known offenders.- Optional Loki. Where a customer prefers Grafana for logs, add an
otlphttp/loki exporter pointing at Loki's native OTLP endpoint and send logs there instead of Elasticsearch, not as well.
- Traces to Elastic. Customers standardised on Elastic Observability can send traces to Elastic's OTLP intake instead of Tempo; the rest of the design is unchanged.
10. Prometheus scrape configuration (if you run Prometheus)
Some customers keep a Prometheus HA pair per site, either because they already have one or to keep local alerting working if the link to the central store fails. The same targets, expressed as plain Prometheus configuration, look like this. The replica external label is the only thing that differs between the two servers.
# prometheus.yml (replica "a"; replica "b" is identical except for the label)
global:
  scrape_interval: 15s
  evaluation_interval: 30s
  external_labels:
    site: lon2
    cluster: ai-prod-1
    replica: a

rule_files:
  - /etc/prometheus/rules/*.yaml

scrape_configs:
  - job_name: dcgm
    file_sd_configs:
      - files: ["/etc/prometheus/targets/gpu-nodes.yaml"]
    relabel_configs:
      - source_labels: [__address__]
        regex: "([^:]+):.*"
        target_label: node
        replacement: "$1"
        action: replace

  - job_name: ufm-telemetry
    scrape_interval: 60s
    scrape_timeout: 50s
    metrics_path: /labels/enterprise
    static_configs:
      - targets: ["ufm-vip.obs.internal:8982"]
        labels:
          fabric: ib-compute
    metric_relabel_configs:
      - source_labels: [__name__]
        regex: "PortXmitDataExtended|PortRcvDataExtended|LinkDownedCounterExtended|LinkErrorRecoveryCounterExtended|LocalLinkIntegrityErrorsExtended|ExcessiveBufferOverrunErrorsExtended|Normalized_CBW|dev_temperature"
        action: keep

  - job_name: otel-collectors
    file_sd_configs:
      - files: ["/etc/prometheus/targets/otel-*.yaml"]

remote_write:
  - url: https://mimir.obs.internal/api/v1/push
    headers:
      X-Scope-OrgID: ai-prod
    queue_config:
      max_samples_per_send: 5000
The target files carry the rack and role labels, so they come from the same source of truth as the agents' environment variables (our inventory), never typed by hand:
# /etc/prometheus/targets/gpu-nodes.yaml
- targets: ["gpu-r07-01:9400", "gpu-r07-02:9400", "gpu-r07-03:9400", "gpu-r07-04:9400"]
  labels:
    rack: r07
    node_role: gpu
11. Fleet-wide labelling scheme
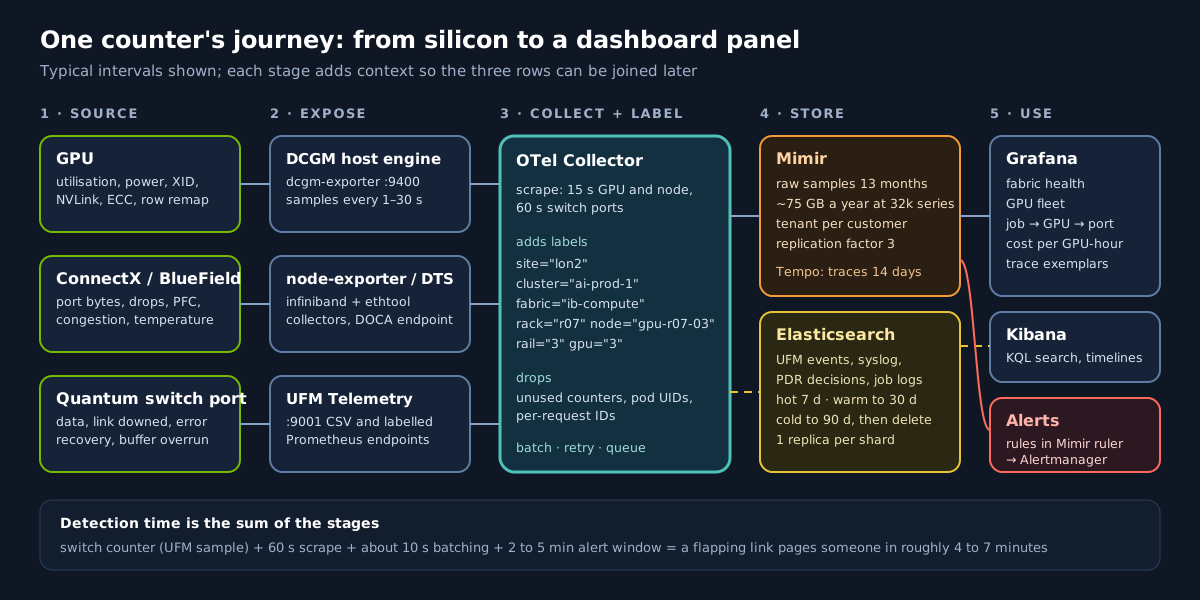
Labels are the joins of observability. If GPU metrics say host="gpu-r07-03.lon2" and fabric metrics say node="GPU-R07-03", no query will ever connect them. We fix one scheme for every customer and every source:
| Label | Example | On | Rule |
|---|
site | lon2 | everything | Data centre or hall; set by the collector |
cluster | ai-prod-1 | everything | Also Mimir's HA cluster label |
env | prod | everything | prod, staging, lab |
fabric | ib-compute | network metrics | ib-compute, ib-storage, eth-frontend, eth-storage, nvlink |
rack | r07 | nodes and switches | From inventory, never derived from hostnames at query time |
node | gpu-r07-03 | node metrics | Short hostname, lower case; we relabel DCGM's Hostname to match |
rail | 3 | GPU and NIC metrics | Rail number in rail-optimised fabrics; equals the GPU index on most HGX designs |
gpu, UUID | 3, GPU-… | GPU metrics only | From dcgm-exporter; the UUID follows the physical GPU through RMAs |
switch, port | leaf-r07-a, 17 | fabric metrics | Normalised from UFM's device and port labels in relabelling |
tenant | genomics | workload metrics | From Kubernetes namespace labels or Slurm account |
hpc_job | 4471823 | GPU metrics only | Never on fabric or node metrics (see cardinality) |
With that in place, the job-to-fabric join is a pair of PromQL joins through our two info metrics, ws_job_node_info{hpc_job, node} (from the scheduler exporter) and ws_ib_link_info{node, hca_port, switch, port} (from the UFM links exporter):
# link-error recoveries in the last hour on every switch port used by job 4471823
sum by (switch, port) (
  increase(LinkErrorRecoveryCounterExtended[1h])
    * on (switch, port) group_left (node)
      (ws_ib_link_info * on (node) group_left () ws_job_node_info{hpc_job="4471823"})
)
12. Alert rules
These rules run in the Mimir ruler (or Prometheus) and route through Alertmanager. Severity page wakes someone up; ticket goes to the queue. Thresholds are starting points we tune per site during the first month.
# rules/ai-cluster.yaml
groups:
  - name: gpu
    rules:
      - alert: GPUXidErrorReported
        expr: changes(DCGM_FI_DEV_XID_ERROR[10m]) > 0 and DCGM_FI_DEV_XID_ERROR != 0
        labels:
          severity: page
        annotations:
          summary: "XID error reported on {{ $labels.node }} GPU {{ $labels.gpu }}"
          runbook: "https://runbooks.obs.internal/gpu/xid"
      - alert: GPURowRemapFailed
        expr: DCGM_FI_DEV_ROW_REMAP_FAILED > 0
        labels:
          severity: page
        annotations:
          summary: "Row remapping failed on {{ $labels.node }} GPU {{ $labels.gpu }}: drain and RMA"
      - alert: GPUUncorrectableRowRemaps
        expr: increase(DCGM_FI_DEV_ROW_REMAP_UNCORRECTABLE_TOTAL[1h]) > 0
        labels:
          severity: ticket
        annotations:
          summary: "New uncorrectable-error row remaps on {{ $labels.node }} GPU {{ $labels.gpu }}"
      - alert: GPUTemperatureHigh
        # set per platform: air-cooled and liquid-cooled systems differ
        expr: max_over_time(DCGM_FI_DEV_GPU_TEMP_CELSIUS[10m]) > 85
        for: 10m
        labels:
          severity: ticket
      - alert: GPUPCIeReplays
        expr: increase(DCGM_FI_DEV_PCIE_REPLAY_TOTAL[15m]) > 100
        labels:
          severity: ticket
      - alert: GPUAllocatedButIdle
        expr: avg by (cluster, hpc_job) (avg_over_time(DCGM_FI_DEV_GPU_UTIL_RATIO{hpc_job!=""}[30m])) < 0.05
        for: 30m
        labels:
          severity: ticket
        annotations:
          summary: "Job {{ $labels.hpc_job }} has held GPUs for 30 minutes at under 5% utilisation"
      - alert: DCGMExporterDown
        expr: up{job="dcgm"} == 0
        for: 5m
        labels:
          severity: page

  - name: infiniband
    rules:
      - record: ws:ib_port_tx_bps:rate5m
        expr: rate(PortXmitDataExtended[5m]) * 8
      - record: ws:ib_port_rx_bps:rate5m
        expr: rate(PortRcvDataExtended[5m]) * 8
      - alert: IBLinkFlapping
        expr: increase(LinkDownedCounterExtended[15m]) >= 2
        labels:
          severity: page
        annotations:
          summary: "Link flapping on {{ $labels.switch }} port {{ $labels.port }}"
      - alert: IBLinkErrorRecovery
        expr: increase(LinkErrorRecoveryCounterExtended[15m]) > 0
        labels:
          severity: ticket
        annotations:
          summary: "Link retrained after errors on {{ $labels.switch }} port {{ $labels.port }}: check cable and transceiver"
      - alert: IBLinkIntegrityErrors
        expr: increase(LocalLinkIntegrityErrorsExtended[15m]) > 0
        labels:
          severity: ticket
      - alert: IBBufferOverruns
        expr: increase(ExcessiveBufferOverrunErrorsExtended[15m]) > 0
        labels:
          severity: ticket
      - alert: IBDeviceHot
        # PDR's default maximum temperature is also 70 C
        expr: dev_temperature > 70
        for: 10m
        labels:
          severity: ticket
      - alert: UFMTelemetryDown
        expr: up{job="ufm-telemetry"} == 0
        for: 5m
        labels:
          severity: page
      - alert: UFMTelemetryMissing
        expr: absent_over_time(PortXmitDataExtended{fabric="ib-compute"}[10m])
        labels:
          severity: page

  - name: pipeline
    rules:
      - alert: CollectorExportFailing
        expr: sum by (instance, exporter) (rate(otelcol_exporter_send_failed_metric_points_total[5m])) > 0
        for: 10m
        labels:
          severity: page
      - alert: CollectorQueueFilling
        expr: max by (instance, exporter) (otelcol_exporter_queue_size / otelcol_exporter_queue_capacity) > 0.8
        for: 10m
        labels:
          severity: ticket
      - alert: GatewayRedundancyLost
        expr: count(up{job="otel-gateway"} == 1) < 2
        for: 5m
        labels:
          severity: page
      - alert: ElasticsearchClusterRed
        expr: max(elasticsearch_cluster_health_status{color="red"}) == 1
        for: 2m
        labels:
          severity: page
      - alert: Watchdog
        # always firing; an external dead man's switch pages if it stops arriving
        expr: vector(1)
        labels:
          severity: heartbeat
Two rules of thumb. First, every page links a runbook that says what to do in the first ten minutes. Second, alerts that fire on counters with increase() need a window at least four times the scrape interval, or a single missed scrape hides the event; that is why the fabric windows are 15 minutes for 60-second scrapes.
13. Logs and events into the Elastic stack
UFM events, switch syslog, PDR decisions, Slurm and UFM-Slurm logs, and host logs go to Elasticsearch. Node logs arrive through the Collector pipeline above. UFM's own streams arrive through its Fluentd-based plugins, which we terminate on a Fluentd aggregator (or Logstash) next to the gateways.
Fluentd: UFM event and telemetry streams to Elasticsearch
The EFS (syslog streaming) and TFS (telemetry) plugins send over the Fluentd forward protocol. This aggregator receives both, adds the fleet labels and writes to data streams with a disk buffer, so an Elasticsearch outage does not lose events. It uses the fluent-plugin-elasticsearch output.
# /etc/fluent/fluentd.conf  (aggregator next to the gateways)
<source>
  @type forward
  port 24224
  bind 0.0.0.0
</source>

<filter **>
  @type record_transformer
  <record>
    site lon2
    cluster ai-prod-1
    fabric ib-compute
  </record>
</filter>

<match **>
  @type elasticsearch_data_stream
  data_stream_name logs-ufm.events-prod
  hosts https://es-hot-1.obs.internal:9200,https://es-hot-2.obs.internal:9200
  user "#{ENV['ES_USER']}"
  password "#{ENV['ES_PASSWORD']}"
  ca_file /etc/fluent/es-ca.pem
  <buffer>
    @type file
    path /var/lib/fluentd/buffer/es
    flush_interval 10s
    chunk_limit_size 8MB
    total_limit_size 4GB
    retry_max_interval 60s
    retry_forever true
  </buffer>
</match>
In practice we split this with two <match> blocks on the tags the two plugins are configured to send, so events and telemetry land in separate data streams with different retention. Sending per-port telemetry counters to Elasticsearch is only worth it when Elastic is the customer's single metrics store; otherwise counters go to Mimir and Elasticsearch gets events.
Logstash: switch syslog
For sites with an existing Logstash tier, switch and UFM syslog can land there instead of on the Collector's syslog receiver:
# /etc/logstash/conf.d/fabric-syslog.conf
input {
  syslog {
    port => 5514
  }
}

filter {
  if [message] =~ /(?i)link (down|up)|transceiver|module (inserted|removed)/ {
    mutate { add_tag => ["fabric_link_event"] }
  }
  mutate {
    add_field => {
      "site"    => "lon2"
      "cluster" => "ai-prod-1"
    }
  }
}

output {
  elasticsearch {
    hosts => ["https://es-hot-1.obs.internal:9200", "https://es-hot-2.obs.internal:9200"]
    data_stream => "true"
    data_stream_type => "logs"
    data_stream_dataset => "network.switch"
    data_stream_namespace => "prod"
    user => "${ES_USER}"
    password => "${ES_PASSWORD}"
    ssl_certificate_authorities => ["/etc/logstash/es-ca.pem"]
  }
}
Retention with index lifecycle management
PUT _ilm/policy/ai-cluster-logs
{
  "policy": {
    "phases": {
      "hot":    { "actions": { "rollover": { "max_age": "1d", "max_primary_shard_size": "50gb" } } },
      "warm":   { "min_age": "7d",  "actions": { "forcemerge": { "max_num_segments": 1 } } },
      "cold":   { "min_age": "30d", "actions": { "set_priority": { "priority": 0 } } },
      "delete": { "min_age": "90d", "actions": { "delete": {} } }
    }
  }
}
Security-relevant streams (UFM audit, authentication) usually need longer retention than 90 days; give them their own data stream and policy rather than lengthening everything.
Useful Kibana queries (KQL) to save as views:
data_stream.dataset : "network.switch" and tags : "fabric_link_event" and host.name : leaf-r07-*
data_stream.dataset : "ufm.events" and message : (*isolat* or *deisolat*)
data_stream.dataset : "ufm.events" and log.level : ("critical" or "error") and not message : *test*
14. Tracing AI inference and training services
Metrics tell you that time to first token went up; traces tell you where the time went. For an inference request the useful spans are the request, the tokeniser, the call to the model server, and the model server's own queueing, prefill and decode. Recent model servers (vLLM, Triton and NVIDIA NIM among them) can emit OpenTelemetry traces themselves when given an OTLP endpoint; check the flags for your version. The application side looks like this, using the OpenTelemetry GenAI semantic-convention attribute names:
from opentelemetry import trace
from opentelemetry.sdk.resources import Resource
from opentelemetry.sdk.trace import TracerProvider
from opentelemetry.sdk.trace.export import BatchSpanProcessor
from opentelemetry.exporter.otlp.proto.grpc.trace_exporter import OTLPSpanExporter

provider = TracerProvider(resource=Resource.create({
    "service.name": "chat-gateway",
    "deployment.environment.name": "prod",
    "cluster": "ai-prod-1",
}))
# the local Collector agent; it adds node and rack labels
provider.add_span_processor(BatchSpanProcessor(OTLPSpanExporter(endpoint="http://127.0.0.1:4317", insecure=True)))
trace.set_tracer_provider(provider)
tracer = trace.get_tracer("ws.inference")


def handle_chat(req, tokenizer, model_client):
    with tracer.start_as_current_span("chat.completions", kind=trace.SpanKind.SERVER) as span:
        span.set_attribute("gen_ai.operation.name", "chat")
        span.set_attribute("gen_ai.request.model", req.model)

        with tracer.start_as_current_span("tokenize") as s:
            ids = tokenizer.encode(req.prompt)
            s.set_attribute("gen_ai.usage.input_tokens", len(ids))

        # the client propagates the W3C traceparent header, so the model
        # server's own spans (queue, prefill, decode) join this trace
        with tracer.start_as_current_span("model_server.generate", kind=trace.SpanKind.CLIENT) as s:
            out = model_client.generate(ids, max_tokens=req.max_tokens)
            s.set_attribute("gen_ai.usage.output_tokens", out.output_tokens)
            s.set_attribute("server.address", out.server)
            if out.gpu_uuid:  # if the server reports which GPU served the request
                s.set_attribute("ws.gpu.uuid", out.gpu_uuid)

        with tracer.start_as_current_span("detokenize"):
            return tokenizer.decode(out.token_ids)
The GPU itself does not emit spans. We join the trace to the hardware through the resource attributes the agent adds (node, rack) and, where the server reports it, the GPU UUID, then use Grafana's trace-to-metrics links to jump from a slow span to that GPU's DCGM panels and that node's fabric ports for the same minute. Request-latency histograms carry exemplars, so a spike on a latency panel links straight to an example trace.
For training, a span per step is far too many. We trace the coarse phases (job start, data loading, each checkpoint save and restore, evaluation) and record step time as a histogram metric with the job label. A sudden rise in step time with flat GPU utilisation and rising link-error recovery on the job's ports is the classic signature of a fabric fault, and the job-to-fabric join in section 11 finds the port.
15. Cardinality and retention
Cardinality, the number of distinct label combinations, drives memory, storage and query cost. AI clusters are well behaved if you are deliberate about it. A worked example for a 32-node, 256-GPU cluster with a rail-optimised InfiniBand compute fabric (about 1,000 ports counting both host and switch ends):
| Source | Series | Interval | Samples per second |
|---|
| UFM fabric counters, 8 kept counters × ~1,000 ports | ~8,000 | 60 s | ~135 |
| Same, if every counter in a debug counter set is streamed (~100) | ~100,000 | 60 s | ~1,670 |
| DCGM, ~27 default fields × 256 GPUs | ~6,900 | 15 s | ~460 |
| node-exporter after the keep list, ~300 × 40 nodes | ~12,000 | 15 s | ~800 |
| Collectors, exporters, UFM system, services | ~5,000 | 15–60 s | ~200 |
| Total (kept counters) | ~32,000 | | ~1,600 |
At roughly 1.5 bytes per compressed sample, 1,600 samples a second is about 75 GB of object storage a year. That is small enough that we keep raw data for 13 months for clusters of this size; Mimir's retention is per tenant, so very large fleets put long-term recording rules in a separate tenant with longer retention than the raw data.
The things that break budgets are labels, not metrics:
- Job IDs on fabric or node series. A busy Slurm cluster runs thousands of jobs a day; each new value creates new series. Keep
hpc_job on GPU series only, and join through ws_job_node_info.
- Pod UIDs, container IDs, request IDs and trace IDs as labels. Drop them in the gateway; trace IDs belong in exemplars.
- Per-lane and per-link counters everywhere. Enable NVLink per-link error counters and per-lane fabric counters for diagnosis, scoped to the nodes under investigation, not by default.
- Raw GUIDs as well as names. Use the labelled UFM endpoint and keep names; one identity label per object is enough.
Retention we start from, and adjust per customer:
| Data | Store | Retention |
|---|
| Metrics (raw) | Mimir | 13 months for clusters up to a few hundred GPUs |
| Metrics (local, if Prometheus is used) | Prometheus | 15 days |
| Traces | Tempo | 14 days, after tail sampling (all errors, all slow requests, 10% of the rest) |
| Fabric and host logs and events | Elasticsearch | hot 7 days, warm to 30, cold to 90, then delete |
| Audit and security logs | Elasticsearch | As the customer's policy requires, often a year or more |
| Topology snapshots and NDT reports | Elasticsearch or object storage | Life of the cluster |
16. High availability of the observability stack
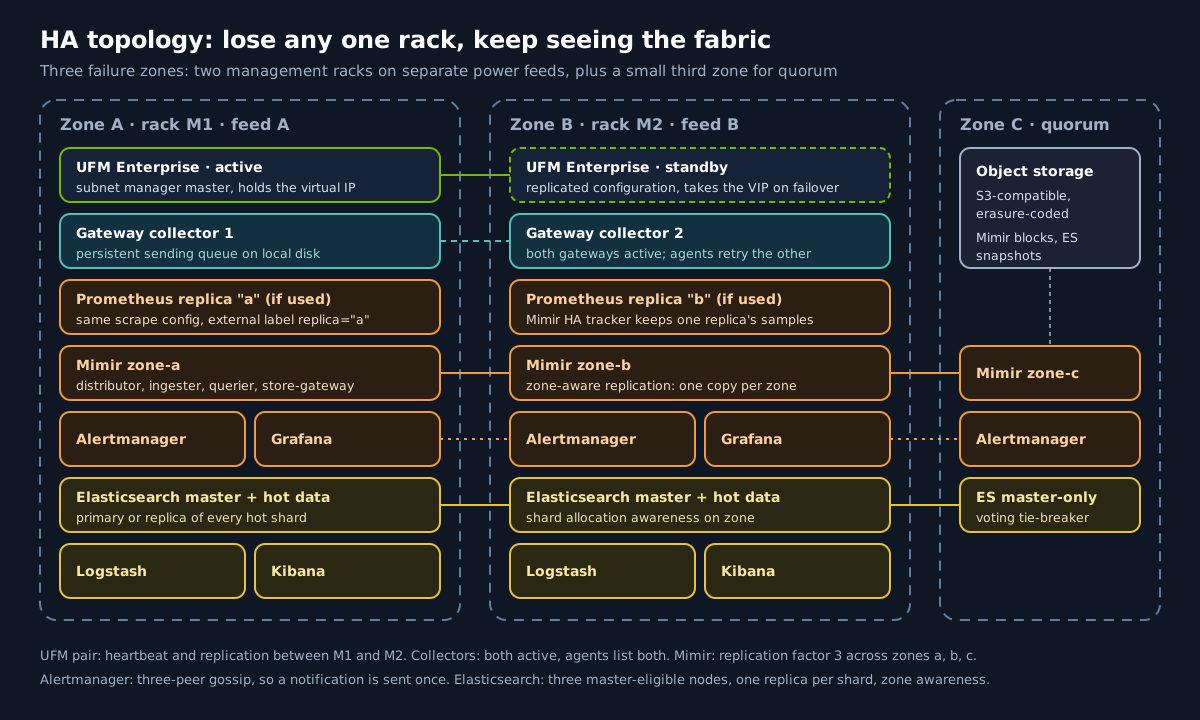
Monitoring that fails at the same time as the thing it monitors is decoration. The design places every stateful component across three failure zones (two management racks on separate power feeds and a small third zone for quorum):
- UFM: active/standby across the two racks; everything talks to the virtual IP. Plugins are loaded on both nodes.
- Collector gateways: at least two, both active. Agents use the pool name and a persistent queue, so a gateway loss is a retry, not a gap. Fabric scrapes run on both and are deduplicated in Mimir.
- Mimir: zone-aware replication with a replication factor of 3, and the HA tracker for the fabric scrapes and any Prometheus pairs.
- Alertmanager: three peers in gossip so each notification goes out once, plus an external dead man's switch fed by the
Watchdog alert.
- Elasticsearch: three master-eligible nodes (one voting-only in the quorum zone), one replica per shard, shard allocation awareness on the zone attribute, and snapshots to object storage.
- Grafana and Kibana: two instances each, stateless behind a load balancer; Grafana uses a shared database, and both are provisioned from Git so a rebuild is a deploy.
The configuration that matters, in Mimir:
# mimir.yaml (excerpt)
distributor:
  ha_tracker:
    enable_ha_tracker: true
    kvstore:
      store: etcd
      etcd:
        endpoints: ["etcd-1.obs.internal:2379", "etcd-2.obs.internal:2379", "etcd-3.obs.internal:2379"]

limits:
  accept_ha_samples: true
  ha_cluster_label: cluster
  ha_replica_label: replica
  compactor_blocks_retention_period: 395d

ingester:
  ring:
    replication_factor: 3
    zone_awareness_enabled: true
    # set per instance: zone-a, zone-b or zone-c
    instance_availability_zone: zone-a
And in Elasticsearch, per node:
# elasticsearch.yml (zone A hot node; the zone C node uses node.roles: [ master, voting_only ])
cluster.name: obs-ai-prod
node.roles: [ master, data_hot, data_content, ingest ]
node.attr.zone: a
cluster.routing.allocation.awareness.attributes: zone
discovery.seed_hosts: [ "es-hot-1.obs.internal", "es-hot-2.obs.internal", "es-quorum-1.obs.internal" ]
The monitoring of the monitoring runs out of band: a small separate Prometheus (or a hosted check) watches the gateways, Mimir, Elasticsearch health and the dead man's switch, so a total loss of the main stack is itself detected.
17. Proving it works: fault drills at handover
We do not hand over a dashboard we have not seen go red. For every new cluster we run, and record:
- Pull a cable between a leaf and a spine during a test job: the flap alert pages within the expected window, UFM raises an event, the event is in Kibana, and the job-to-fabric view shows which job crossed that port.
- Fail the active UFM server: the standby takes the virtual IP, scrapes resume, and the gap in fabric data is shorter than the alert window.
- Stop a gateway: no data loss, a
GatewayRedundancyLost page, and recovery when it returns.
- Stop an Elasticsearch node and a Mimir zone: queries still answer, writes continue, health alerts fire.
- Run PDR in dry-run against a deliberately marginal cable on a lab port: the "would isolate" decision appears in the log store.
- Compare as-built with design using the NDT plugin and file the report with the handover pack.
18. How Workstation delivers and runs this
Workstation is an NVIDIA partner, so alongside the hardware we provide engineering, software and staff to set up and run AI data centres end to end: design, installation, fabric bring-up, UFM and observability set-up, and the engineers who operate it with you afterwards. NVIDIA's own overview of UFM is on the official NVIDIA Unified Fabric Manager (UFM) page.
- Supply: GPU systems, InfiniBand and Ethernet switches, adapters, optics and UFM licences, specified together.
- Build: UFM HA, plugins, Slurm or Kubernetes integration, DCGM and dcgm-exporter, Collector agents and gateways, and either our hosted backends or yours, all from versioned configuration.
- Run: managed observability around the clock: alert tuning, upgrades (including migrations like the dcgm-exporter 4.9.0 renames), capacity planning for the monitoring stack, and a monthly report on GPU efficiency, fabric faults and cost per useful GPU-hour.
For a sizing conversation, ask our AI Sales Engineer or browse the networking and DGX ranges in the shop.
19. Sources and verification notes
- NVIDIA UFM overview and tiers: the official NVIDIA Unified Fabric Manager (UFM) page.
- UFM SDK plugins, ports, paths, counter names and PDR defaults: the READMEs and dashboards in Mellanox/ufm_sdk_3.0, read in November 2026. Plugin behaviour changes between releases; check the README for the version you deploy.
- dcgm-exporter metric names and the 4.9.0 renames:
etc/default-counters.csv and the 4.9.0 release notes in NVIDIA/dcgm-exporter.
- OpenTelemetry Collector components are from the contrib distribution; configuration keys move between releases, so validate with
otelcol-contrib validate --config=... before deploying.
- UFM tier packaging, NetQ and DOCA Telemetry Service details are described generally; consult NVIDIA's current documentation for exact features and licensing for your versions.
- Counter names marked
ws: or ws_ are Workstation conventions (recording rules and info metrics), not NVIDIA metrics.
Acknowledgement of rights: NVIDIA, the NVIDIA logo, DGX, HGX, Quantum, Spectrum, Spectrum-X, BlueField, ConnectX, NVLink, DOCA, DCGM and Unified Fabric Manager (UFM) are trademarks and/or registered trademarks of NVIDIA Corporation in the United States and other countries. NVIDIA products and technologies may be covered by patents and other intellectual property rights owned by NVIDIA Corporation, and all such rights are acknowledged and reserved to their owners. Product information is summarised in our own words from NVIDIA's public documentation; NVIDIA's website and documentation are the authoritative source. Other company and product names, including Prometheus, Grafana, Elasticsearch, Kibana, Logstash, OpenTelemetry, Kubernetes and Slurm, may be trademarks of their respective owners. Workstation's own dashboards, configurations and text are © Workstation.