Observability for Agentic AI: Tracing, Evaluating and Auditing Agents

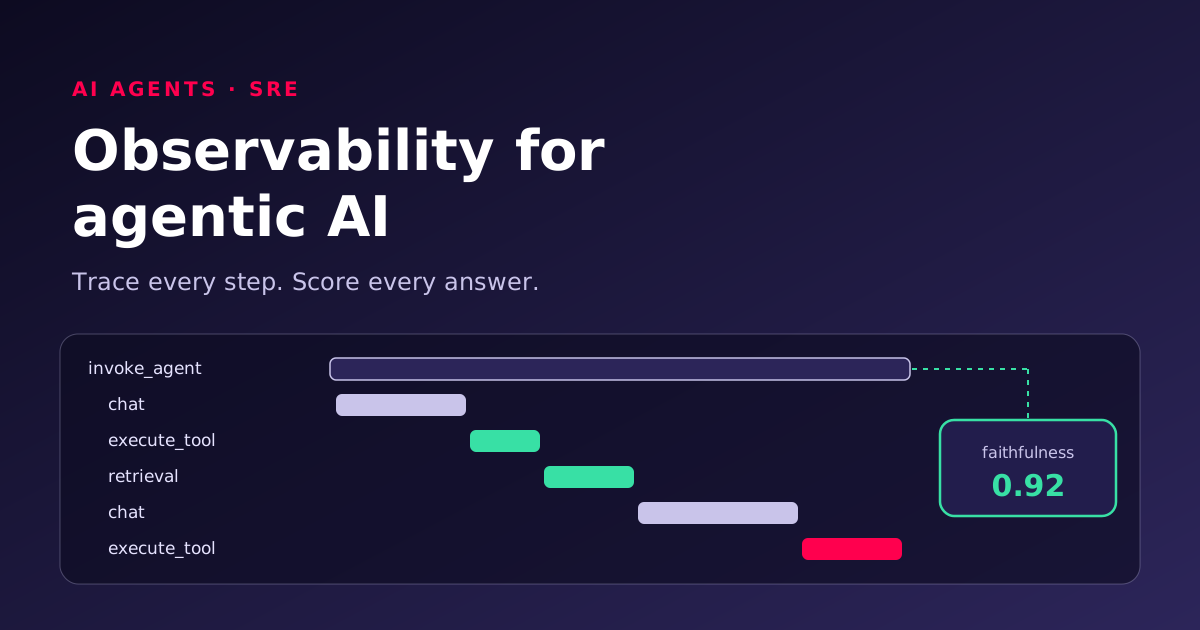
An AI agent that fails rarely throws an error. It returns a confident answer built on the wrong document, or calls a tool with the wrong argument, and your dashboards stay green. This post shows how to trace what an agent actually did, attach quality scores to those traces, and keep the records an auditor will ask for, using open standards rather than one vendor's format.
Why request-level monitoring misses agent failures
An agent here means software that uses a language model to plan, call tools (APIs, databases, other services), retrieve documents and take several steps before answering. A RAG pipeline (retrieval-augmented generation) is the narrower case: retrieve documents, then ask the model to answer from them.
Three properties make agents hard to monitor with the tools built for web services:
- Non-determinism. The same request can take a different path: different tools, a different number of model calls, a different answer.
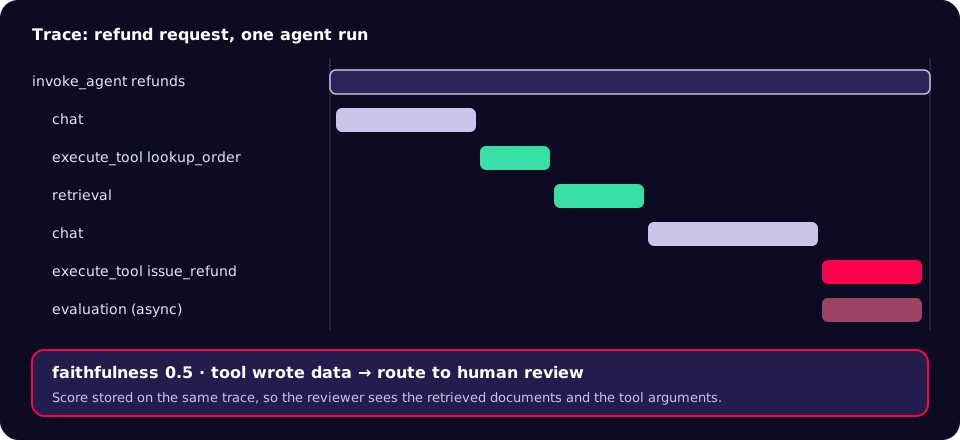
- Long, branching runs. One user request becomes a tree of model calls, retrievals and tool executions. A single latency number per request hides where time and money went.
- Side effects. Agents write as well as read: they send emails, update records, issue refunds. A wrong action is an incident even when every HTTP call returned 200.
Uptime, latency and error rate still matter, but they answer "did it respond?" The question that matters for an agent is "did it do the right thing, with the right data, and can we show that?" Austin Parker of Honeycomb argues that "pretty dashboards, pre-built alerts, and magic integrations aren't sufficient" for this kind of software [1].
| Question | Classic APM | Agent observability |
|---|---|---|
| What is one unit of work? | A request | A run: a tree of model, retrieval and tool spans |
| What counts as failure? | Exception, 5xx, timeout | Also: unsupported answer, wrong tool, wrong argument, policy breach |
| What is captured? | Timings, status, stack traces | Also: model, token usage, tool arguments, retrieved document IDs, quality scores |
| How do you reproduce it? | Replay the request | Inspect the stored trace; re-running may take a different path |
| Cost signal | CPU, memory, requests | Tokens and tool calls per successful outcome |
The shape of an agent trace
OpenTelemetry, the open standard most observability back ends accept, now has semantic conventions for generative AI, maintained in their own repository [2]. They are marked Development, meaning names can still change, but they give you a shared vocabulary instead of inventing your own [2]:
invoke_agent {gen_ai.agent.name}: the span for one agent run, with attributes such asgen_ai.agent.name,gen_ai.agent.versionandgen_ai.conversation.id[3].chatand other inference spans for each model call, carryinggen_ai.request.model,gen_ai.usage.input_tokensandgen_ai.usage.output_tokens[3][4].execute_tool {gen_ai.tool.name}for each tool call, withgen_ai.tool.call.id. The conventions note that tools are often run by your own code and encourage you to instrument those calls by hand [4].retrievalspans for the retrieval pipeline [4].
The conventions also define agent metrics, including gen_ai.invoke_agent.duration, gen_ai.invoke_agent.tool_calls and gen_ai.execute_tool.duration [5].
Instrument it: a minimal pattern
Most agent frameworks and model SDKs have instrumentation libraries that emit inference spans for you. The gaps are usually your own tools and your agent's identity. A Python sketch using the OpenTelemetry API:
from opentelemetry import trace

tracer = trace.get_tracer("refund-agent")

def run_agent(conversation_id: str, request: str):
    with tracer.start_as_current_span("invoke_agent refunds") as span:
        span.set_attribute("gen_ai.operation.name", "invoke_agent")
        span.set_attribute("gen_ai.agent.name", "refunds")
        span.set_attribute("gen_ai.agent.version", "2026-11-01")
        span.set_attribute("gen_ai.conversation.id", conversation_id)
        return plan_and_act(request)   # model calls traced by your SDK instrumentation

def call_tool(name: str, call_id: str, fn, **kwargs):
    with tracer.start_as_current_span(f"execute_tool {name}") as span:
        span.set_attribute("gen_ai.operation.name", "execute_tool")
        span.set_attribute("gen_ai.tool.name", name)
        span.set_attribute("gen_ai.tool.call.id", call_id)
        span.set_attribute("app.tool.writes_data", name in {"issue_refund"})
        return fn(**kwargs)   # exceptions are recorded on the span by default
The app.tool.writes_data attribute is our own convention, not part of the standard. Marking write actions lets you alert on them and sample them at 100%.
Prompts and outputs are sensitive
The conventions treat model instructions, user messages and outputs as sensitive and say instrumentations "SHOULD NOT capture them by default" [4]. Where a library supports capture, the environment variable is OTEL_INSTRUMENTATION_GENAI_CAPTURE_CONTENT, with values NO_CONTENT (the default), SPAN_ONLY, EVENT_ONLY and SPAN_AND_EVENT [4]. For production the conventions recommend storing content externally and recording only a reference on the span, because "external storage enables separate access controls" [4]. Check your instrumentation library's documentation, as older releases used different variable names.
You do not need a special back end to start. Langfuse, an open-source LLM observability tool, accepts OTLP over HTTP at /api/public/otel and maps gen_ai.* attributes such as model and token usage to its own fields [6]. Any OTLP-compatible tracing back end will at least store and display the spans.
Score the outcome, not just the run
Observability tells you what happened. Evaluation tells you whether it was right. Keep them on the same record.
- Deterministic checks first. Did the tool arguments pass schema validation? Did the refund exceed the order value? Did the answer cite a document that was actually retrieved? These are cheap and unambiguous.
- Reference-free model-graded metrics. Ragas defines faithfulness as how "factually consistent a response is with the retrieved context", scored from 0 to 1 by checking each claim in the answer against the context [7]. Treat such scores as signals to triage, not as ground truth; calibrate them against human labels.
- Online evaluation on sampled traffic. In Langfuse, LLM-as-a-judge rules set "filters, sampling rate, and one or more evaluator assignments", and results are stored as scores on the evaluated observation [8]. Traceloop has described building "real-time versions of known metrics like faithfulness, relevancy, redundancy" for the same purpose [9].
- Simulation before release. For voice and conversational agents, teams generate test conversations from personas. Vocera's founders described manual testing of healthcare voice agents as "incredibly time-consuming and error-prone" and built persona simulation to replace it [10].
Audit: what regulated teams must be able to show
Some obligations already require records of this kind. In the US, the HIPAA Security Rule requires "hardware, software, and/or procedural mechanisms that record and examine activity" in systems that contain or use electronic protected health information [11]. In the EU, Article 12 of the AI Act says high-risk AI systems "shall technically allow for the automatic recording of events (logs) over the lifetime of the system" [12]; the AI Act Explorer lists that article as applying from 2 December 2027 for Annex III systems [12]. Whether these apply to you depends on your sector and use case, so take legal advice; the engineering pattern is the same either way.
For each run, be able to answer: who asked, which agent version and model answered, which records were retrieved or changed, which tools ran with which arguments, what score it received, and who approved it if a human did. Store content separately from operational telemetry so access can be restricted, as the OpenTelemetry conventions suggest [4].
Playbook: from blind to auditable
- Name the runs. Wrap every agent entry point in an
invoke_agentspan with agent name, version and conversation ID. - Instrument every tool by hand where needed. One
execute_toolspan per call, with a flag for write actions. - Turn on SDK instrumentation for model calls so model, token usage and finish reasons arrive without custom code.
- Decide on content capture. Default off; in production, store content externally with tighter access and reference it from the span [4].
- Add deterministic checks on tool arguments and outputs, and record their results as scores or span attributes.
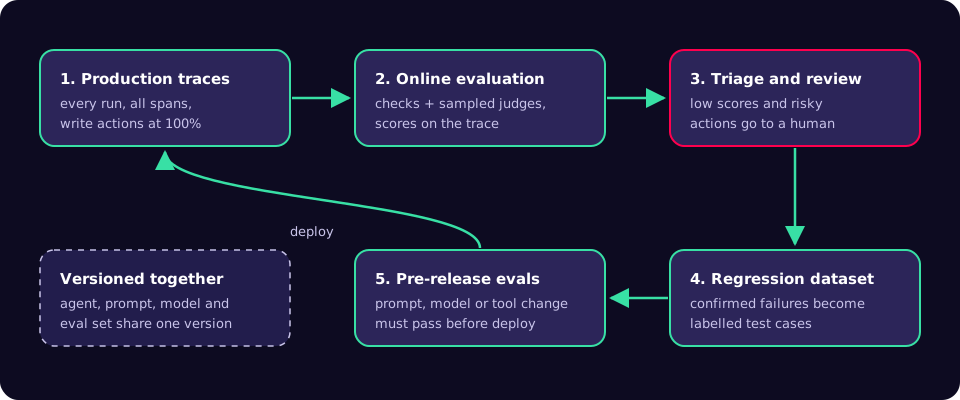
- Add one model-graded metric, such as faithfulness for RAG answers, on a sample of production traffic [7][8]. Label 50 to 100 traces by hand to see whether it agrees with you.
- Route low scores and write actions to review. Human-in-the-loop for high-risk actions, based on the signals above.
- Close the loop. Every confirmed failure becomes a regression test that runs before the next prompt, model or tool change ships.
- Track cost per successful outcome, not cost per call. Nikola Balić's agentic handbook puts it plainly: "A production agent is not 'free.' It trades one cost for another" [13].
Checklist
- Every run has one trace ID that links model calls, retrievals and tool calls.
- Agent version, prompt version and model are recorded on every run.
- Write actions are marked, alerted on and kept at 100% sampling.
- Prompt and output content is off by default, or stored with separate access control.
- At least one quality score is attached to production traces and checked against human labels.
- A regression set built from real failures runs in CI.
- You can answer "who asked, what data, what action, who approved" for any run.
Common mistakes
- Only tracing the model call. Most damaging failures are in tool arguments and retrieved data.
- Logging full prompts to the general log pipeline. That copies personal data into a system with broad access.
- Trusting a judge model blindly. Model-graded scores drift and disagree with humans; calibrate them.
- Treating evaluation as a launch gate only. Production inputs change; scores must run continuously.
- Inventing attribute names per team. Use the GenAI conventions so tools and dashboards line up, and pin the version, since they are still in Development [2].
- Using agents where they do not pay. The same handbook lists tasks "faster to do by hand than to specify precisely" as a case where agents are not worth it [13].
What to do this week
- Pick one production agent and draw its trace by hand: which spans exist today, which are missing?
- Add an
execute_toolspan to the one tool that writes data. - Check where prompts and outputs currently end up, and who can read them.
- Label 30 recent runs as good or bad yourself. That is the start of your evaluation set.
- Write down the five audit questions above and test whether you can answer them for yesterday's runs.
The teams that run agents well treat traces and scores as one product, owned like any other production system. If you are putting agents into production and want help with tracing, evaluation and guardrails, see how we approach AI agents.
References
- It's The End Of Observability As We Know It (And I Feel Fine) (Austin Parker, Honeycomb, June 2025)
- OpenTelemetry GenAI semantic conventions repository (OpenTelemetry)
- Semantic conventions for GenAI agent and framework spans (OpenTelemetry)
- Semantic conventions for generative client AI spans (OpenTelemetry)
- Semantic conventions for generative AI metrics (OpenTelemetry)
- OpenTelemetry integration (Langfuse documentation)
- Faithfulness (Ragas documentation)
- LLM-as-a-Judge (Langfuse documentation)
- Launch HN: Traceloop (YC W23) – Detecting LLM Hallucinations with OpenTelemetry (Hacker News, July 2024)
- Launch HN: Vocera (YC F24) – Testing and Observability for Voice AI (Hacker News, December 2024)
- 45 CFR § 164.312 Technical safeguards (Legal Information Institute)
- Article 12: Record-Keeping, EU AI Act (AI Act Explorer)
- The Agentic AI Handbook: Production-Ready Patterns (Nikola Balić, January 2026)